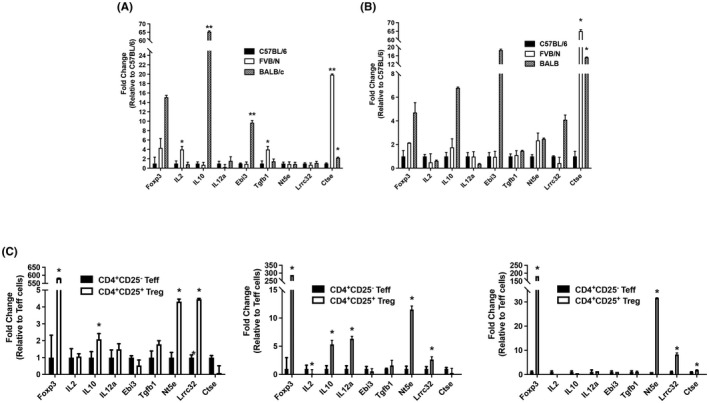
FIGURE 4.

RNA expression of various Treg markers. (A) mRNA expression of Treg markers on CD4+CD25− Teff cells. Cells were cultured for 2 days with anti‐CD3 and anti‐CD28 stimulation to expand cell numbers. RNA was isolated, cDNA generated, and expression analyzed. (B) mRNA expression of Treg markers on CD4+CD25+ Treg cells. Cells were cultured for 2 days to expand cell numbers. RNA was isolated, cDNA generated, and expression analyzed. (C) Comparison of mRNA expression of each strain's Tregs relative to Teff cells. *p ≤ 0.05; **p ≤ 0.01; ***P ≤ 0.001. Data are representative of 2 independent experiments, with 4 samples per group. Mean + standard deviation is shown.
