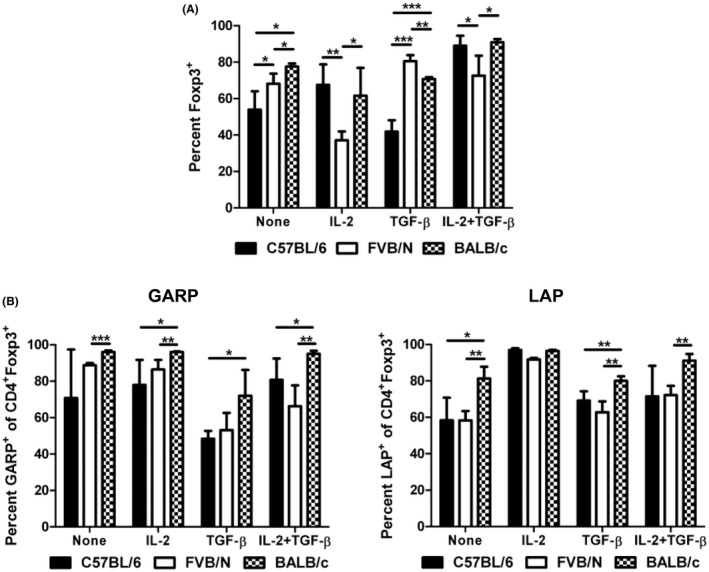
FIGURE 5.

Different expressions of Foxp3, GARP, and LAP in activated Treg cells. (A) CD4+CD25+ Treg cells were isolated from the spleen via MACS and cultured for 4 days with anti‐CD3 and anti‐CD28 stimulation (2 × 10⁶ cells/well in a 96‐well round‐bottom plate). IL‐2, TGF‐β, or both were used to maintain the expression of Foxp3 in these cells. Foxp3 expression was analyzed by flow cytometry. Lymphocytes were gated based on forward scatter/side scatter and then subsequently gated on CD4 + cells. (B) GARP and LAP expression on activated CD4+Foxp3+ tTreg cells. CD4+CD25+ cells were cultured for 2 days with anti‐CD3 and anti‐CD28 stimulation. Il‐2 and TGF‐β were added as indicated. After 2 days of culture, Foxp3, GARP, and LAP expression were analyzed by flow cytometry. Lymphocytes were gated based on forward scatter/side scatter and then subsequently gated on CD4+Foxp3+ cells. *p ≤ 0.05; **p ≤ 0.01; ***p ≤ 0.001. Data are representative of 3 independent experiments, with 4 mice per group. Mean + standard deviation is shown.
