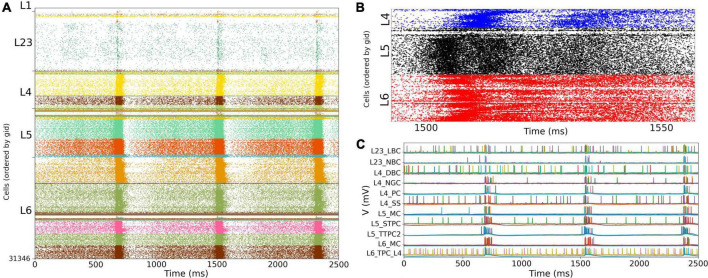
FIGURE 6.
NetPyNE S1 circuit response to background inputs with short-term plasticity (STP). (A) Spiking raster plot of S1 with STP. S1 and thalamus were not interconnected; only intracortical connections were included. (B) Amplified spiking raster plot (A) showing the 70 ms around the time when synchronous bursts first occur in L5 (black) and then propagate to L6 (red) and L4 (blue). (C) Example traces from (A) showing spike synchrony across cortical populations. Rasters in A show 2.5 s after steady state was reached.

