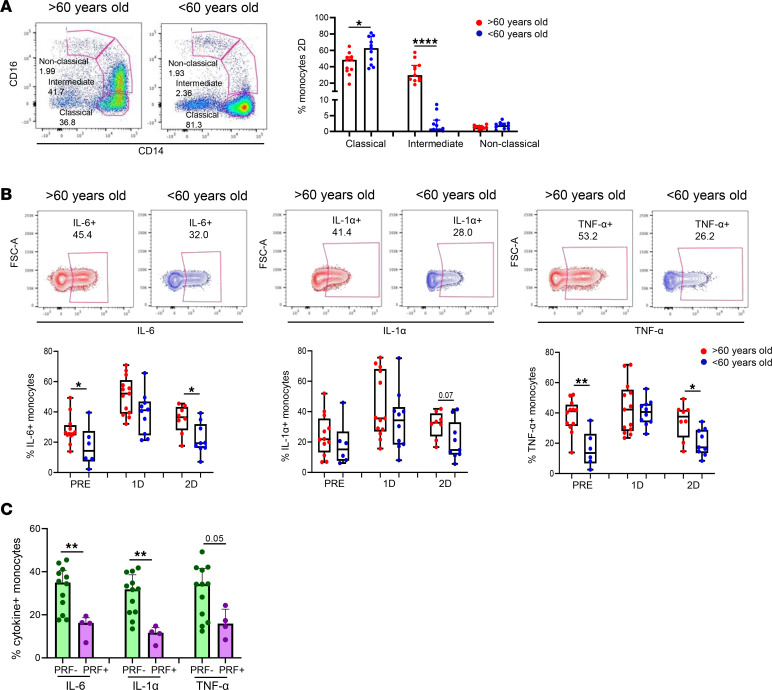
Figure 8. Higher monocyte-mediated proinflammatory profile found in aged people is associated with a lower T cell response to SARS-CoV-2 vaccine.
(A) Bar graphs representing the percentage of classical, intermediate, and nonclassical monocytes in > 60-year-old (red) and < 60-year-old (blue) participants before SARS-CoV-2 vaccination (PRE), 3 weeks after the first dose (1D), and 2 months after the second dose (2D) of vaccination (right). Pseudocolor plots showing representative data of a > 60-year-old and < 60-year-old participant 2 months after the second dose (left). (B) Box-and-whisker plots (min to max) representing the percentage of IL-6+, IL-1α+, and TNF-α+ monocytes upon TLR-4 stimulation in > 60-year-old (red) and < 60-year-old (blue) participants at the 3 time points (bottom). Contour plots showing representative data of the percentage of cytokine+ monocytes from a > 60-year-old and < 60-year-old subject 2 months after the second dose (top). (C) Bar graphs showing the percentage of cytokine (IL-6, IL1-α, and TNF-α) producing monocytes on individuals with a cytotoxic SARS-CoV-2 S–specific T cell response and the ones with a negative response. The percentage of specific PRF+ T cells higher than 0.01 was considered as a positive cytotoxic T cell response. Mann-Whitney U and Wilcoxon tests were used (n = 26). Friedman test was applied in B, (IL-6: > 60-year-old, P = 0.223, and < 60-year-old, P = 0.368; IL-1α: > 60-year-old, P = 1.00, and < 60-year-old, P = 0.368; TNF-α: > 60-year-old, P = 0.223, and < 60-year-old, P = 0.368).

