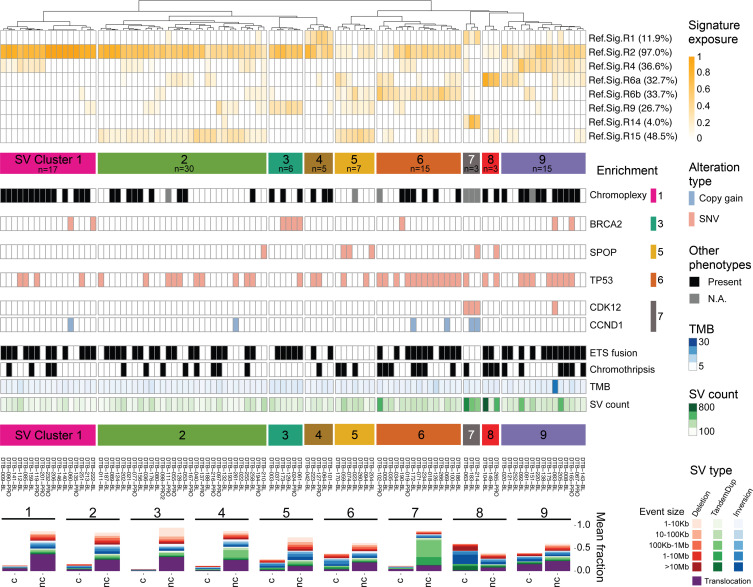
Figure 4. Clustering of mCRPC SV signatures.
SV signature analysis and hierarchical clustering identify 9 distinct molecular groups in the mCRPC cohort of 101 samples sequenced with standard short reads. Top: Dendrogram of the clustering of SV signature exposure. The prevalence of each signature was computed based on having ≥0.05 exposure (proportion of SVs). Middle: Enrichment of altered prostate cancer drivers. Enriched alterations in clusters 1, 3, 5, 6, and 7 are shown based on statistical significance by χ2 test. Bottom: Composition of SV types and sizes for each SV cluster, separated by non-clustered (nc) and clustered (c) SV events. The number of samples per cluster is indicated in the corresponding cluster label.

