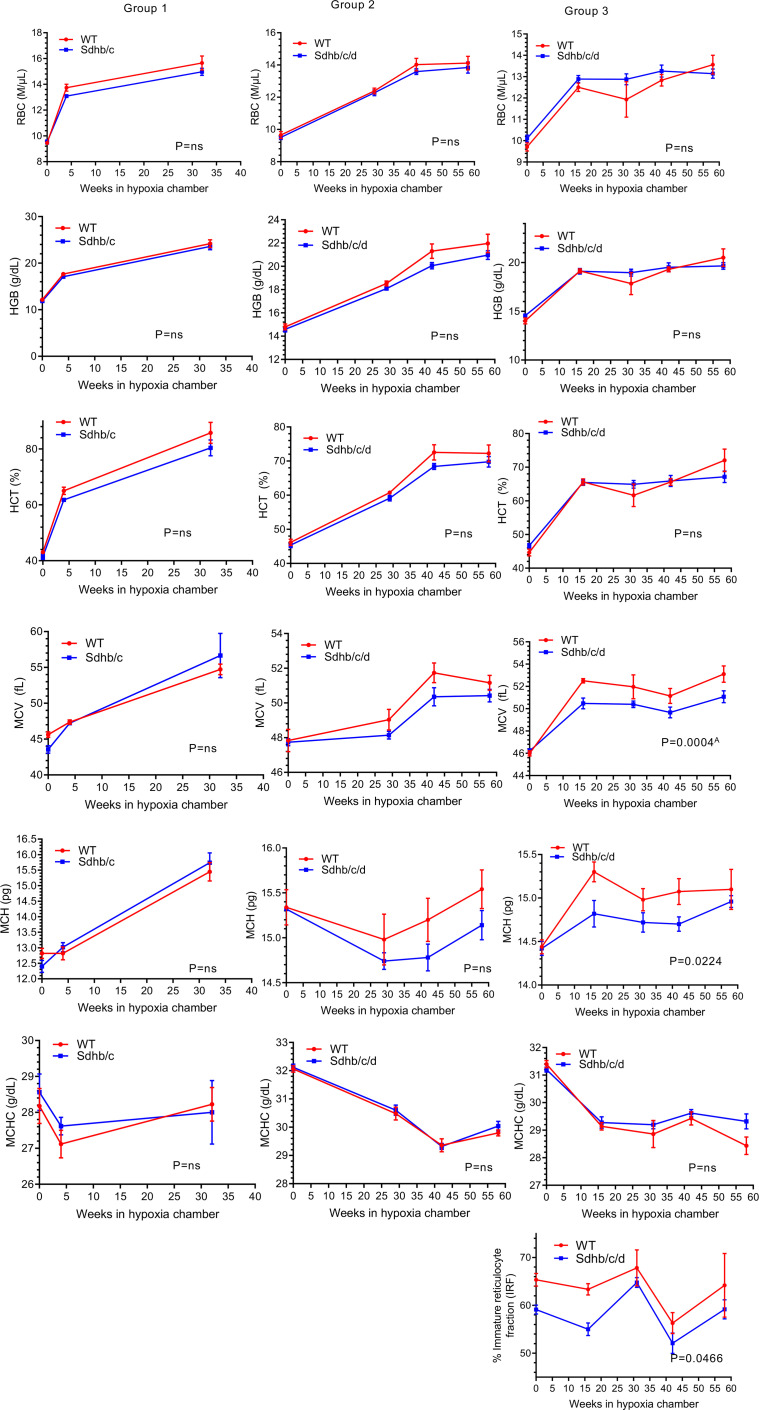
Figure 3. RBC, hemoglobin, hematocrit, mean corpuscle volume, mean corpuscle hemoglobin, mean corpuscle hemoglobin concentration, and immature reticulocyte fraction in Sdh hKO (Sdhb/c in group 1 and Sdhb/c/d in groups 2 and 3) and WT control mice under chronic hypoxia.
RBC numbers, hemoglobin (HGB) and hematocrit (HCT), mean corpuscle volume (MCV), mean corpuscle hemoglobin (MCH), mean corpuscle hemoglobin concentration (MCHC), and immature reticulocyte fraction (IRF) are shown. Each time point contains 3–5 male mice and shows mean and SEM. P values are calculated by 2-way ANOVA using time and genotype as independent variables. AP value remains significant (less than 0.05) after adjustment for multiple comparisons by Holm-Šídák method (α: 0.05). The missing parameter IRF in groups 1 and 2 was not available in earlier CBC outputs. HGB results of groups 1 and 2 were previously shown in Sharma et al. (58) and included here for comprehensive analysis.

