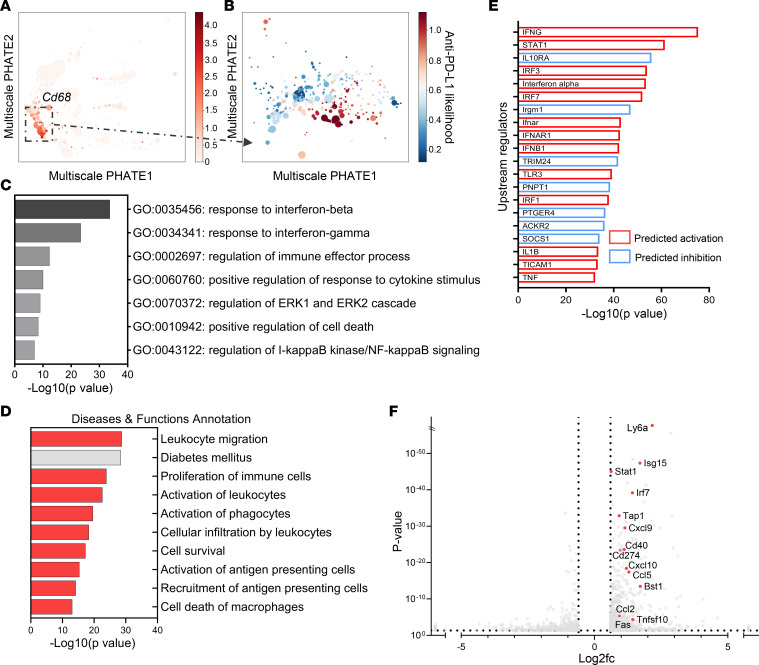
Figure 4. Differentially expressed pathways and genes in islet-infiltrating macrophages with anti–PD-L1 versus anti–CTLA-4 mAb treatment.
(A) Macrophages (CD68+) are highlighted on Multiscale PHATE visualization of all cells treated with anti–CTLA-4 and anti–PD-L1. (B) MELD analysis of macrophage subpopulations showed differences between anti–PD-L1 versus anti–CTLA-4 treatment conditions. (C) Metascape analysis of differentially expressed genes by scRNA-Seq between anti–PD-L1–treated and anti–CTLA-4–treated islet-infiltrating macrophages. (711 genes based on P < 0.05, q < 0.05, log2fc ≤ –0.6 and ≥ 0.6). (D) Diseases and functions represented by differentially expressed genes between anti–PD-L1– and anti–CTLA-4–treated macrophages by Ingenuity Pathway Analysis (IPA; QIAGEN). Predicted activation state is for anti–PD-L1 macrophages compared with anti–CTLA-4 macrophages. Activation z score cutoffs ≤ –2 and ≥ 2. Red = predicted to be activated, and gray = significant change without defined direction. (E) Top 20 predicted upstream regulators in macrophages by IPA. Red = upregulated in anti–PD-L1 macrophages, and blue = downregulated in anti–PD-L1–treated macrophages. (F) Volcano plot of differentially expressed genes in anti–PD-L1 versus anti–CTLA-4 treatment macrophages. Highlighted genes include IFN-γ–responsive genes. There were 1,329 differentially expressed genes based on P < 0.05, q < 0.05 (not shown), log2fc ≤ –0.6 and ≥ 0.6.

