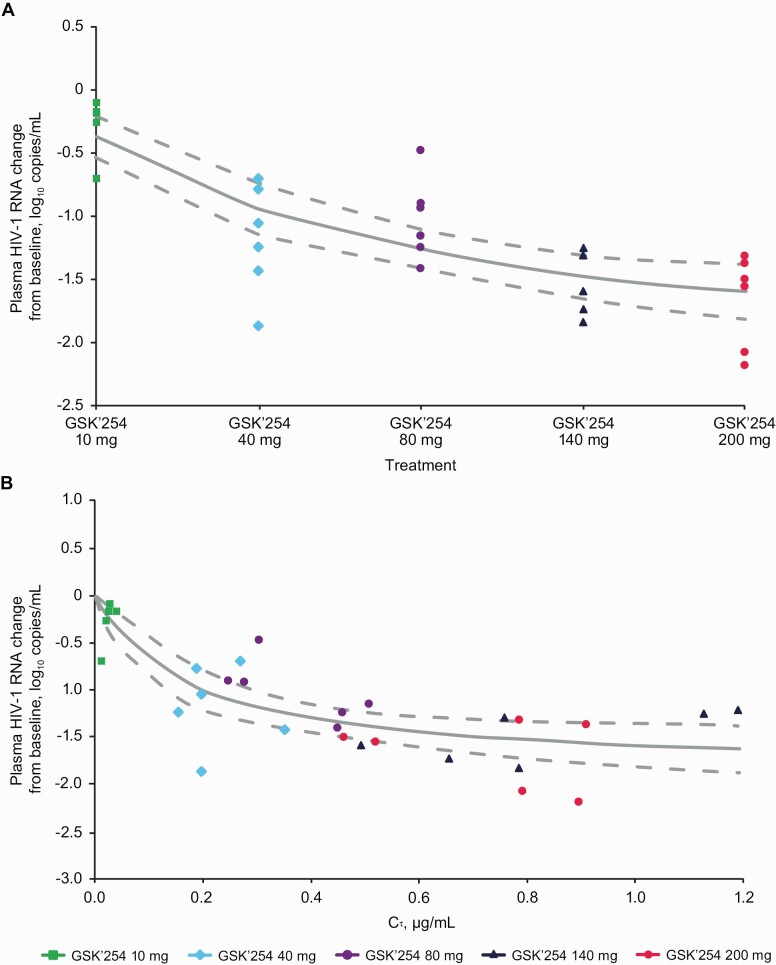
Figure 4.
Maximum change from baseline to day 8 in log10 plasma HIV-1 RNA vs (A) GSK’254 dose and (B) Cτ fitted to an Emax nonlinear model. Solid and dashed lines represent the fitted value from the Emax model and 95% confidence interval, respectively. Abbreviations: Cτ, concentration at the end of the dosing interval; Emax, maximum effect; GSK’254, GSK3640254; HIV-1, human immunodeficiency virus type 1.

