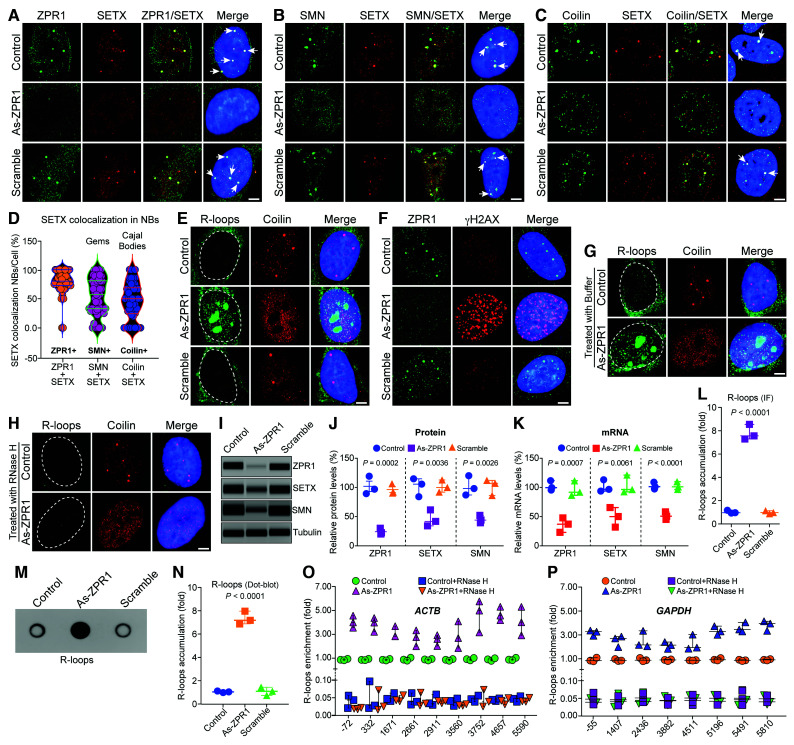
Figure 2.
ZPR1 co-localizes with SETX in nuclear bodies and its deficiency causes disruption of gems and Cajal bodies, downregulation of SETX and accumulation of R-loops. HeLa cells (Control) or transfected with 100 nM antisense oligonucleotides against human ZPR1 (As-ZPR1) or scrambled sequence oligo (Scramble) were fixed and stained with antibodies for immunofluorescence (IF) analysis. (A) Control and scramble oligo treated HeLa cells show ZPR1 (green) and SETX (red) co-localize in subnuclear foci (arrows) and knockdown of ZPR1 (As-ZPR1) causes disruption of SETX+ foci and shows decrease in staining of SETX (red). (B) SETX (red) co-localizes with SMN (green) in nuclear gems (arrows) in control cells. As-ZPR1 causes disruption of SETX+ (red) foci and SMN+ (green) gems. (C) SETX (red) co-localizes with Coilin (green) in Cajal bodies (CBs) (arrows) in control cells. As-ZPR1 causes disruption of SETX+ foci and Cajal bodies. (D) Quantification of SETX co-localization in subnuclear bodies (NBs)/cell (%) is shown as a violin plot with median and interquartile range (Q1, median, Q3) (50 cells/group). SETX co-localization with ZPR1: ZPR1 + SETX (72.73, 80.00, 100.00), SMN: SMN + SETX (32.89, 57.14, 80.83) and coilin: Coilin + SETX (24.31, 50.00. 68.75). Quantification of SETX co-localization (mean ± SEM, n = 50 cells/group) show the highest co-localization with ZPR1 (79.60 ± 3.03%) compared to SMN (54.01 ± 4.51%) (gems) and Coilin (47.00 ± 4.46%) (Cajal bodies). (E) Accumulation of RNA:DNA hybrids (R-loops) in ZPR1-deficient cells detected by monoclonal antibody (S9.6). As-ZPR1 causes accumulation of R-loops (green) and disruption of Cajal bodies (Coilin) (red). (F) ZPR1 (green) deficiency causes accumulation of γH2AX foci, a marker for DNA damage (red). (G and H) Specificity of R-loops detection by S9.6 antibody established by digestion of R-loops with the RNase H enzyme. Cells transfected with As-ZPR1 were permeabilized and treated with (G) buffer only and (H) RNase H enzyme for 20 min at room temperature, washed and fixed with 4% PFA. R-loops (green), coilin (red), nuclei (blue). Dotted circular lines indicate nuclei. Scale bar = 5.0 μm. (I–K) ZPR1 knockdown causes downregulation of SETX. (I) Immunoblots (IBs) of ZPR1, SETX, SMN and tubulin from cell lysates of Control, As-ZPR1 and Scramble transfected HeLa cells. Full-length blots are included in Supplementary Fig. 7C. (J) Quantitation of changes in ZPR1, SETX, and SMN protein levels with ZPR1 knockdown are shown as a scatter plot with median and range (min, median, max). ZPR1: Control (87.69, 95.35, 117.60), As-ZPR1 (18.36, 20.63, 28.32), Scramble (88.69, 90.32, 104.70); SETX: Control (82.79, 104.50, 113.70), As-ZPR1 (32.65, 40.36, 60.21), Scramble (90.65, 98.63, 111.70); SMN: Control (85.32, 96.32, 118.40), As-ZPR1 (37.65, 42.32, 50.32), Scramble (84.36, 105.40, 110.30). Quantitative (mean ± SEM, n = 3) and statistical analysis (ANOVA) show knockdown of ZPR1 levels to (22.44 ± 3.01%, P = 0.0002) decreases SETX levels to (44.41 ± 8.20%, P = 0.0036) and SMN levels to (43.43 ± 3.69%, P = 0.0026) compared to Control and Scramble. (K) Quantitation of changes in ZPR1, SETX, and SMN mRNA levels with ZPR1 knockdown are shown as a scatter plot with median and range. ZPR1: Control (93.70, 97.90, 109.90), As-ZPR1 (21.07, 35.09, 45.98), Scramble (84.65, 90.02, 109.70); SETX: Control (92.50, 95.50, 112.00), As-ZPR1 (30.50, 48.60, 64.17), Scramble (91.20, 95.20, 120.00); SMN: Control (95.70, 99.60. 107.20), As-ZPR1 (43.60, 49.00, 56.40), Scramble (94.87, 99.30, 108.00). Knockdown of ZPR1 mRNA expression to (34.05 ± 7.21%, P = 0.0007) causes downregulation of SETX mRNA expression to (47.76 ± 9.72%, P = 0.0061) and SMN mRNA to (49.67 ± 3.71%, P < 0.0001) compared to Control and Scramble. (L) Quantitative analysis of nuclear R-loop immunofluorescence intensity with NIH ImageJ software show ZPR1-deficient cells (As-ZPR1) accumulate R-loops (7.80 ± 0.37-fold, P < 0.0001) compared to Control and Scramble cells. R-loops nuclear intensity levels were quantified from three experiments (30 cells/group). Quantitative analysis of R-loop levels is shown as a scatter plot with median and range. Control (0.94, 0.97, 1.17), As-ZPR1 (7.29, 7.56, 8.54), Scramble (0.88, 0.98, 1.13). (M) Dot-blot analysis of R-loops using S9.6 antibody and genomic DNA isolated from control, As-ZPR1 and Scramble treated cells. (N) Densitometric quantitative analysis of R-loop levels in dot-blot shown as a scatter plot with median and range. Control (0.93, 0.99, 1.06), As-ZPR1 (6.81, 7.13, 7.91), Scramble (0.68, 1.04, 1.39). Quantitation of R-loop levels in dot-blot shows ZPR1-deficient cells (As-ZPR1) accumulate R-loops (7.28 ± 0.32-fold, P < 0.0001) compared to control and scramble cells. (O and P) Quantitative mapping of R-loop accumulation throughout transcription of the β-Actin (ACTB) and GAPDH genes. DRIP was performed using S9.6 antibody and genomic DNA prepared from control, control + RNase H, ZPR1-deficient (As-ZPR1) and As-ZPR1 + RNase H treated HeLa cells. DRIP and input DNA were used for qPCR analysis using specific primers pairs to amplify different regions of R-loop accumulation during transcription of the ACTB gene in (O) control, control + RNase H, As-ZPR1 and As-ZPR1 + RNase H, and (P) the GAPDH gene in control, control + RNase H, As-ZPR1 and As-ZPR1 + RNase H. Quantitative analysis (mean ± SEM, n = 3) shows ZPR1-deficiency causes ∼4-5-fold R-loop accumulation throughout transcription, including transcription start. Loss of R-loops with RNase H treatment shows specificity of DRIP analysis.

