Figure 3.
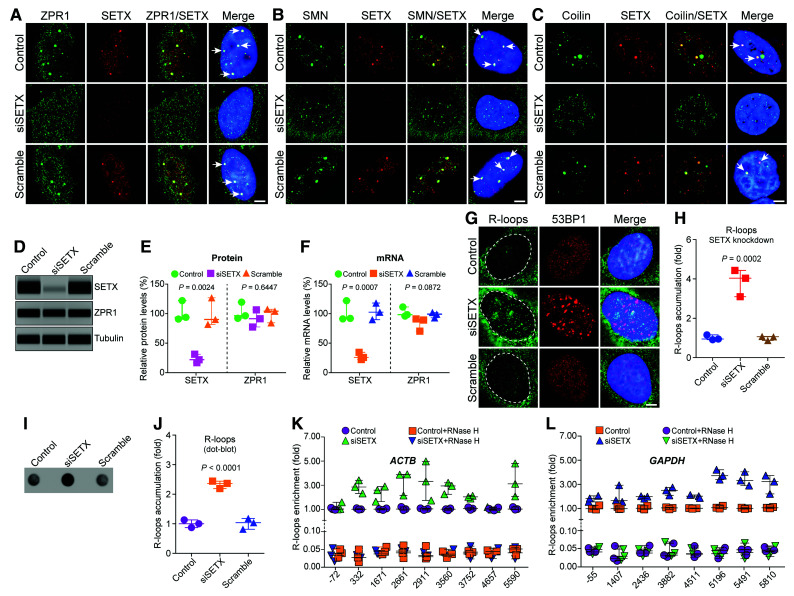
SETX deficiency causes disruption of ZPR1 positive nuvlear bodies, gems and Cajal bodies and accumulation of R-loops during transcription. HeLa cells, untransfected (Control) or transfected with 100 nM siRNA against SETX (siSETX) and siRNA with scrambled sequence (Scramble), were fixed and stained with antibodies for immunofluorescence (IF) analysis. (A) Control and Scramble oligo treated HeLa cells show ZPR1 (green) and SETX (red) co-localize in subnuclear foci (arrows) and knockdown of SETX (siSETX) causes disruption of SETX+ and ZPR1+ foci and results in mislocalization of ZPR1 (green) in the nucleoplasm. (B) SETX (red) co-localizes with SMN (green) in nuclear gems (arrows) in control cells. Knockdown of SETX (siSETX) causes disruption of SMN+ foci (gems) resulting many smaller gem-like foci. (C) SETX (red) co-localizes with coilin (green) in Cajal bodies (CBs) (arrows) in control cells. Knockdown of SETX (siSETX) causes disruption of Cajal bodies and result in several small coilin+ foci. (D) Immunoblots of SETX, ZPR1 and tubulin from cell lysates of Control, siSETX and Scramble transfected HeLa cells. Full-length blots are included in Supplementary Fig. 7D. (E) Quantitation of changes in SETX and ZPR1 protein levels with SETX knockdown (siSETX) are shown as a scatter plot with median and range (min, median, max). SETX: Control (89.32, 92.39, 120.70), siSETX (15.32, 20.35, 29.63), Scramble (80.32, 88.62, 125.60); ZPR1: Control (90.32, 94.65, 117.70), siSETX (75.63, 89.65, 104.60), Scramble (82.69, 102.40, 105.60). Quantitation shows knockdown of SETX (siSETX) levels to (21.77 ± 4.19%, P = 0.0024) did not significantly change ZPR1 levels (89.97 ± 8.37%, P = 0.6447) compared to Control and Scramble. (F) Quantitation of changes in SETX and ZPR1 mRNA levels with SETX knockdown (siSETX) are shown as a scatter plot with median and range (min, median, max). SETX: Control (89.53, 90.31, 120.40), siSETX (20.55, 24.12, 32.72), Scramble (88.26, 100.80, 116.40); ZPR1: Control (94.23, 96.48, 109.50), siSETX (68.64, 87.54, 89.33), Scramble (91.10, 97.36, 100.20). Knockdown of SETX mRNA expression to (25.80 ± 3.61%, P = 0.0007) does not significantly alter ZPR1 mRNA expression (81.83 ± 6.61%, P = 0.0872) compared to Control and Scramble. (G) SETX-deficiency (siSETX) causes accumulation of R-loops (green) and 53BP1 foci (red), a marker for DNA damage. (H) Quantitative analysis of nuclear R-loop immunofluorescence intensity with NIH ImageJ software is shown as a scatter plot with median and range (min, median, max). Control (0.91, 0.95, 1.15), siSETX (3.09, 4.03, 4.43), Scramble (0.87, 1.06, 1.07). Quantitation of nuclear R-loops shows SETX-deficient cells (siSETX) accumulate R-loops (3.85 ± 0.39-fold, P = 0.0002) compared to Control and Scramble cells. R-loops nuclear intensity levels were quantified from three experiments (30 cells/group). (I) Dot-blot analysis of R-loops using S9.6 antibody and genomic DNA isolated from Control, siSETX and Scramble treated cells. (J) Densitometric quantitative analysis of R-loop levels in dot-blot shown as a scatter plot with median with range (min, median, max). Control (0.87, 1.0, 1.13), siSETX (2.19. 2.36, 2.44), Scramble (0.81, 1.03, 1.18). SETX-deficient cells (siSETX) accumulate higher R-loops (2.33 ± 0.07-fold, P < 0.0001) compared to control and scramble cells. (K and L) Quantitative mapping of R-loop accumulation throughout transcription of the β-Actin (ACTB) and GAPDH genes. DRIP was performed using S9.6 antibody and genomic DNA prepared from control, control + RNase H, SETX-deficient (siSETX) and siSETX + RNase H treated HeLa cells. DRIP and input DNA were used for qPCR analysis using specific primers pairs to amplify different regions of R-loop accumulation during transcription of the ACTB gene in (K) control, control + RNase H, siSETX and siSETX + RNase H (L) the GAPDH gene in control, control + RNase H, As-ZPR1 and siSETX + RNase H. Quantitative analysis (mean ± SEM, n = 3) of SETX-deficiency shows R-loop accumulation (∼2-3-fold) throughout transcription except at the start of transcription compared to control. Loss of R-loops with RNase H treatment shows specificity of DRIP analysis.

