Figure 4.
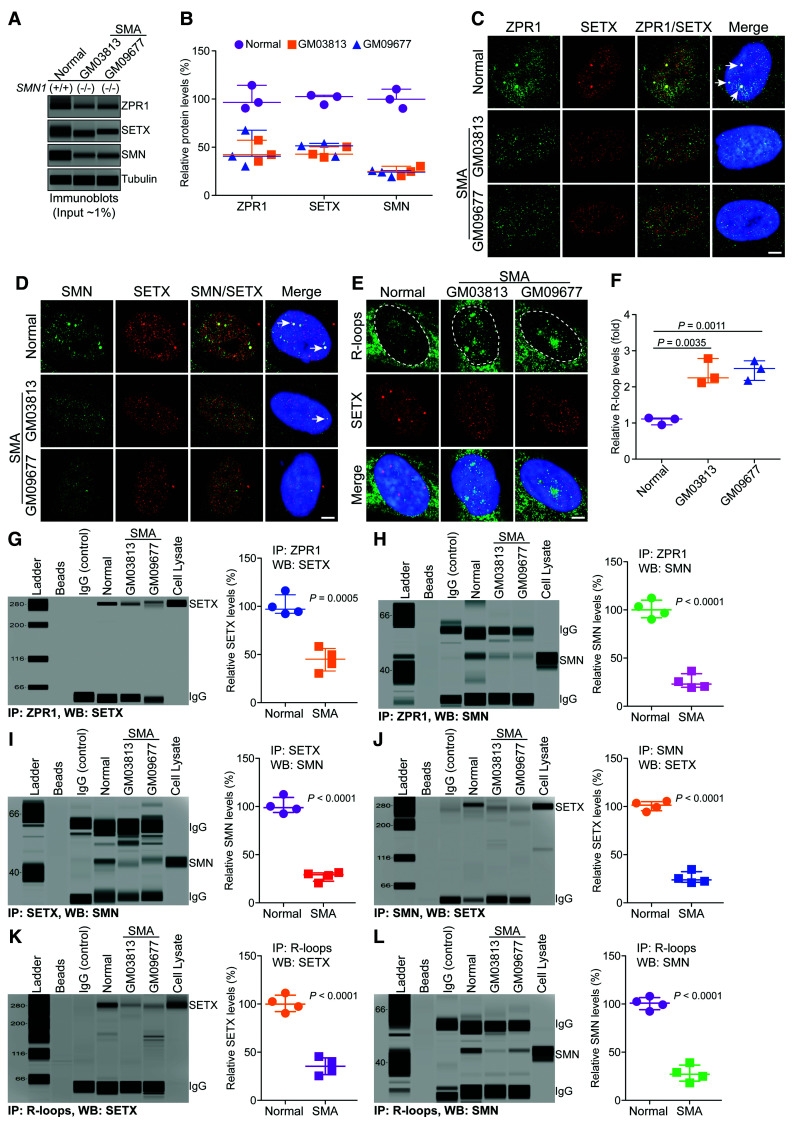
Chronic low levels of ZPR1 impair assembly of RLRC in SMA. Cultured WI-38 (Normal) and primary fibroblast derived from SMA type I patients, GM03813 and GM09677 (SMA) that have homozygous deletion of the SMN1 gene, were used for immunofluorescence, immunoprecipitation and immunoblot analyses. (A) Representative capillary-blot images of proteins are shown (full-length blots are included in Supplementary Fig. 8). (B) Comparison of protein levels between normal and SMA patient cells (GM03813 and GM09677) is shown as a scatter plot with median and range (min, median, max). ZPR1: Normal (90.58, 96.54, 114.30), GM03813 (35.42, 42.36, 57.32), GM09677 (30.25, 40.65, 67.65); SETX: Normal (94.21, 102.60, 104.00), GM03813 (39.50, 42.81, 50.49), GM09677 (40.42, 51.39, 54.05); SMN: Normal (90.32, 99.87, 110.30), GM03813 (20.31, 24.81, 30.29), GM09677 (19.31, 24.20, 25.68). Quantitative analysis (mean ± SEM, n = 3, t-test, unpaired) show SMN1 mutation results in the low levels SMN in GM03813 (25.14 ± 2.88%, P = 0.0003) and GM09677 (23.06 ± 1.92%, P = 0.0002) SMA patient cells compared to normal cells. Chronic SMN-deficiency is known to cause splicing defects and alter expression of many genes. Analysis of core components of RLRC shows ZPR1 levels decreased to (45.03 ± 6.46%, P = 0.0045) in GM03813 and (46.18 ± 11.15%, P = 0.0148) in GM09677. SETX levels decreased to (44.27 ± 3.25%, P = 0.0002) in GM03813 and (48.62 ± 4.17%, P = 0.0006) in GM09677 compared to control. (C–E) Representative images are presented for double-labelled immunostainings that show chronic SMN-deficiency causes disruption of subnuclear bodies and mislocalization of RLRC core proteins, ZPR1 and SETX of RLRC: (C) ZPR1 (green) co-localizes with SETX (red) in subnuclear foci in normal (arrows) but is mislocalized in SMA. (D) SMN (green) co-localizes with SETX (red) in subnuclear foci in normal but is mislocalized in SMA. (E) Accumulation of R-loops (green) and disruption of SETX (red) subnuclear bodies in SMA patients compared normal cells. Nuclei were stained with DAPI (blue). Scale bar = 5.0 μm. Dotted circular lines indicate nuclei. (F) Comparison of nuclear R-loop intensity between normal and SMA (GM03813, GM09677) patient cells is shown as a scatter plot with median and range. Normal (0.95, 1.11, 1.14), GM03813 (2.11, 2.25, 2.78), GM09677 (2.17, 2.51, 2.72). Quantitative (mean ± SEM, n = 3) and statistical (unpaired t-test) analysis of R-loop intensity in the nucleus show increase in R-loop accumulation in SMA, GM03813 (2.38 ± 0.20-fold, P = 0.0035) and GM09677 (2.46 ± 0.15-fold, P = 0.0011) compared to normal cells. R-loops nuclear intensity levels were quantified from three experiments (30 cells/group). Data from dot-blot and quantitative analysis of R-loop is included in Supplementary Fig. 8B and C. Chronic ZPR1-deficiency results in decrease of ZPR1 complexes with SETX and SMN in SMA compared to normal cells. Immunoprecipitation of ZPR1 shows decrease in co-IP of (G) SETX and (H) SMN from SMA (GM03813, GM09677) compared to normal cells. Comparison of SETX and SMN co-IP levels with ZPR1 in Normal and SMA patient cells is presented as a scatter plot with median and range. SETX: Normal (92.30, 97.01, 116.7), SMA (30.48, 45.21, 58.40); SMN: Normal (90.23, 100.10, 112.30) and SMA (19.40, 23.06, 36.59). Quantitation (mean ± SEM, n = 4) and statistical (unpaired t-test) analysis shows decreased SETX (44.83 ± 6.02%, P = 0.0005) and SMN (25.53 ± 3.91%, P < 0.0001) co-IP with ZPR1 in SMA cells compared to normal cells. (I) Immunoprecipitation of SETX shows decrease in co-IP of SMN from SMA compared to normal cells. Quantitation of SMN co-IP with SETX in SMA compared to normal cells is shown as a scatter plot with median and range. Normal (92.40, 98.69, 112.40) and SMA (20.52, 29.20, 31.40). Quantitation shows decrease in SMN (27.58 ± 2.43%, P < 0.0001) co-IP levels with SETX in SMA cells compared to normal. (J) Immunoprecipitation of SMN shows decrease in co-IP of SETX from SMA compared to normal cells. Quantitation of SETX co-IP with SMN in SMA compared to normal cells is shown as a scatter plot with median and range. Normal (94.30, 101.30, 105.40) and SMA (20.98, 23.87, 105.40). Quantitation shows decrease in SETX (25.84 ± 3.07%, P < 0.0001) co-IP levels with SMN in SMA cells compared to normal. (K and L) Comparison of accumulation of SETX and SMN on R-loops and assembly of RLRC between normal and SMA cells. (K) Immunoprecipitation of R-loops shows decreased association of SETX with RNA:DNA hybrids in SMA compared to normal cells. Quantitation of SETX (35.40 ± 4.53%, P < 0.0001) co-IP levels with R-loops in normal and SMA cells is presented as a scatter plot with median and range. SETX: Normal (90.30, 99.87, 111.30) and SMA (25.49, 35.36, 45.39). (L) Immunoprecipitation of R-loops shows decreased association of SMN with RNA:DNA hybrids in SMA compared to normal cells. Quantitation of SMN (27.83 ± 4.36%, P < 0.0001) co-IP levels with R-loops in normal and SMA cells is presented as a scatter plot with median and range. Normal (92.30, 100.80, 107.90) and SMA (18.20, 27.03, 39.07).

