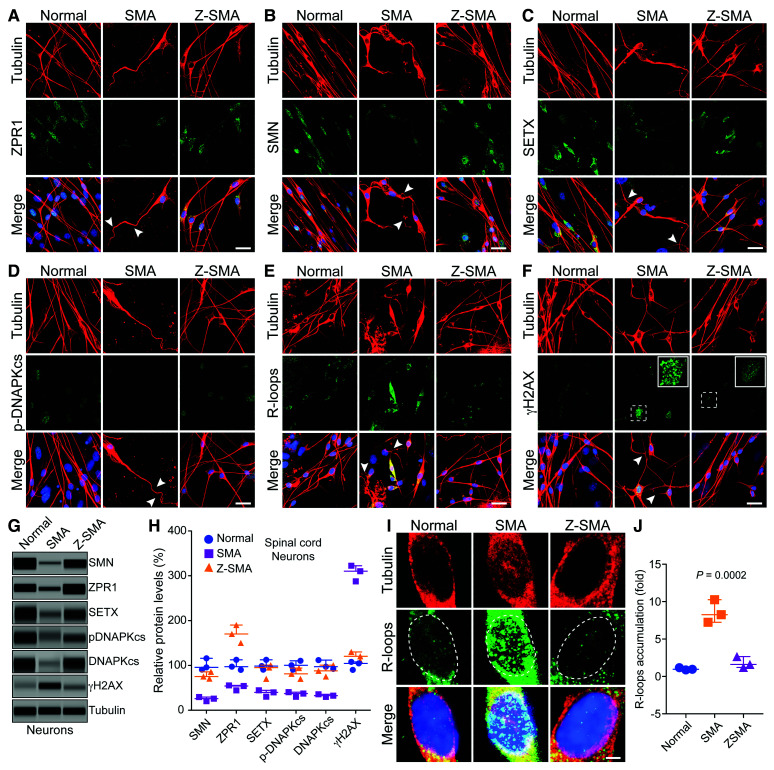
Figure 6.
ZPR1 overexpression in vivo rescues DNA damage associated with R-loop accumulation and prevents degeneration of motor neurons in SMA. Primary spinal cord neurons were cultured from 7-day-old normal, SMA and Z-SMA (SMA mice with ZPR1 overexpression under the control of mouse Rosa26 promoter) mice. Neurons were differentiated in vitro for 12 days and stained with antibodies against neuron-specific β-tubulin-III (red), SMN, SETX, p-DNA-PKcs, R-loops and γH2AX, and immunofluorescence was examined by confocal microscopy. (A–F) Axonal defects include retraction, bending, folding of axons (arrowheads) that indicate degeneration of SMN-deficient neurons. (A) Staining of neurons with ZPR1 (green) and β-tubulin (red), (B) staining of neurons with SMN (green) and β-tubulin (red), (C) SETX (green) and β-tubulin (red), (D) p-DNA-PKcs (green) and β-tubulin (red), (E) R-loops (green) and β-tubulin (red) and (F) γH2AX (green) and β-tubulin (red). Insets show higher magnification of punctate staining of γH2AX foci indicating DNA damage. Z-SMA neurons with in vivo ZPR1 overexpression show rescue of degenerative features. Nuclei were stained with DAPI (blue). Scale bar = 25 μm. (G) Immunoblot analysis of cultured primary spinal cord motor neurons from Normal, SMA and Z-SMA mice for detecting changes in levels of ZPR1, SMN, SETX, DNA-PKcs, p-DNA-PKcs, and DNA damage marker, γH2AX (full-length blots, Supplementary Fig. 10). (H) Quantitation of protein levels in motor neurons from Normal, SMA, and Z-SMA mice is shown as a scatter plot with median and range (min, median, max). SMN: Normal (90.54, 95.64, 115.90), SMA (20.36, 25.87, 29.54), Z-SMA (70.65, 75.32, 85.65); ZPR1: Normal (90.21, 97.25, 112.50), SMA (44.25, 54.21, 55.47), Z-SMA (150.20, 170.30, 190.30); SETX: Normal (90.65, 98.54, 112.50), SMA (30.25, 39.87, 44.56), Z-SMA (70.25, 81.25, 94.21); p-DNA-PKcs: Normal (90.54, 100.30, 110.30), SMA (30.21, 37.32, 40.25), Z-SMA (70.25, 81.25, 94.21); DNA-PKcs: Normal (92.36, 97.25, 112.00), SMA (29.87, 32.65, 35.68), Z-SMA (75.32, 87.98, 100.70); γH2AX: Normal (90.25, 104,50, 108.0), SMA (287.5, 310.30, 322.60), Z-SMA (110.20, 120.40, 130.30). Statistical analysis (ANOVA) of immunoblot data (mean ± SEM, n = 3 mice/group) from spinal cord neurons shows increase in ZPR1 levels (1.70 ± 0.11-fold, P = 0.0001) results in increase of SMN levels to (77.21 ± 4.43%, P = 0.0002), SETX (88.73 ± 9.36%, P = 0.0012), p-DNA-PKcs (81.90 ± 6.92%, P = 0.0037) and total DNA-PKcs (87.98 ± 7.31%, P = 0.0018) leading to a marked decrease in γH2AX levels from 306.80 ± 10.26% to 120.30 ± 5.77% (P = 0.0002). (I) Higher magnification images of nuclei of neurons stained with antibody against R-loops (green) and β-tubulin (red) from Normal, SMA and Z-SMA spinal cord neurons (dotted lines show nuclei). (J) Quantitation of nuclear immunofluorescence R-loop intensity in Normal, SMA, and Z-SMA spinal cord neurons is shown as a scatter plot with median and range. Normal (0.87, 0.95, 1.17), SMA (7.2, 8.25, 10.25), ZSMA (1.20, 1.60, 2.65). Quantitative analysis of nuclear R-loop immunofluorescence shows marked reduction in R-loop accumulation (1.82 ± 0.43-fold) in Z-SMA compared to SMA (8.58 ± 0.88)-fold (P = 0.0023, t-test), and compared to Normal (1.04 ± 0.09-fold) (P = 0.0002, ANOVA) neurons.

