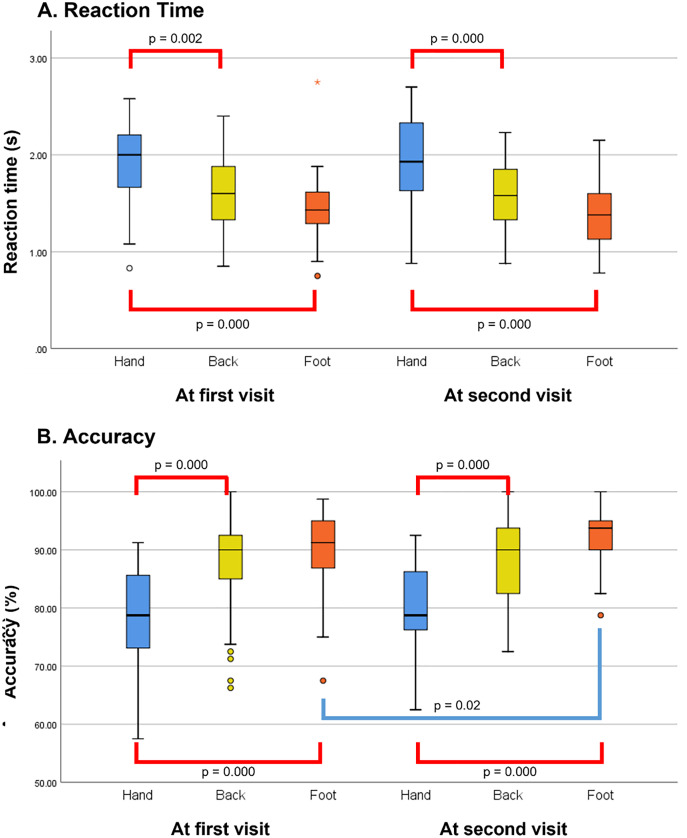
Figure 3. Group differences in the left/right judgement test over the follow-up period.
(A) Group differences in the reaction time. (B) Group differences in the accuracy. The red line indicates the significant post-hoc Bonferroni analysis and Tukey’s test findings for this comparison, performed following an overall main effect of task. The p-value of both post-hoc analyses were identical. The blue line indicates the significant paired t-test findings.

