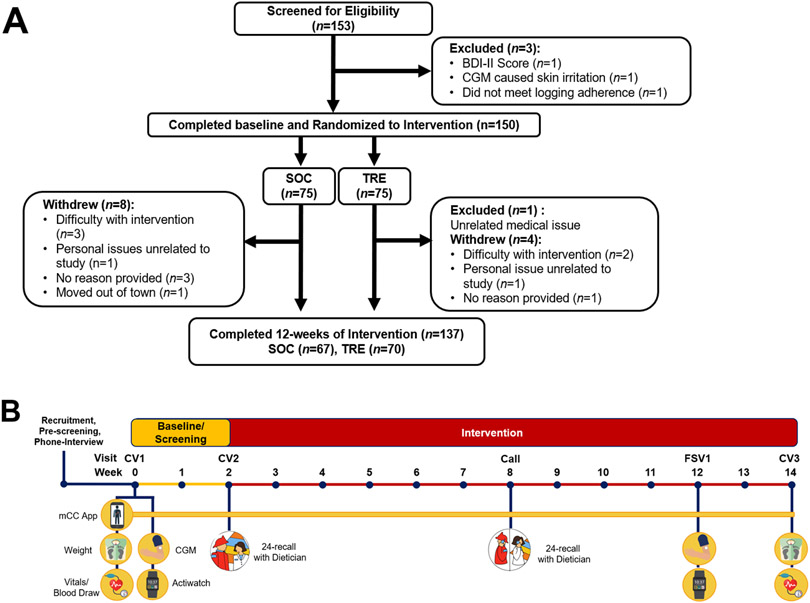
Figure 1. Consort Diagram and study timeline.
(A) Consort diagram and participants from screening through completion of the 12-week intervention. (B) Timeline of study events during baseline and 12-week intervention. SOC = Standard of Care, TRE = Time-restricted Eating, BDI-II = Beck Depression Inventory-II, CGM = Continuous Glucose Monitor.

