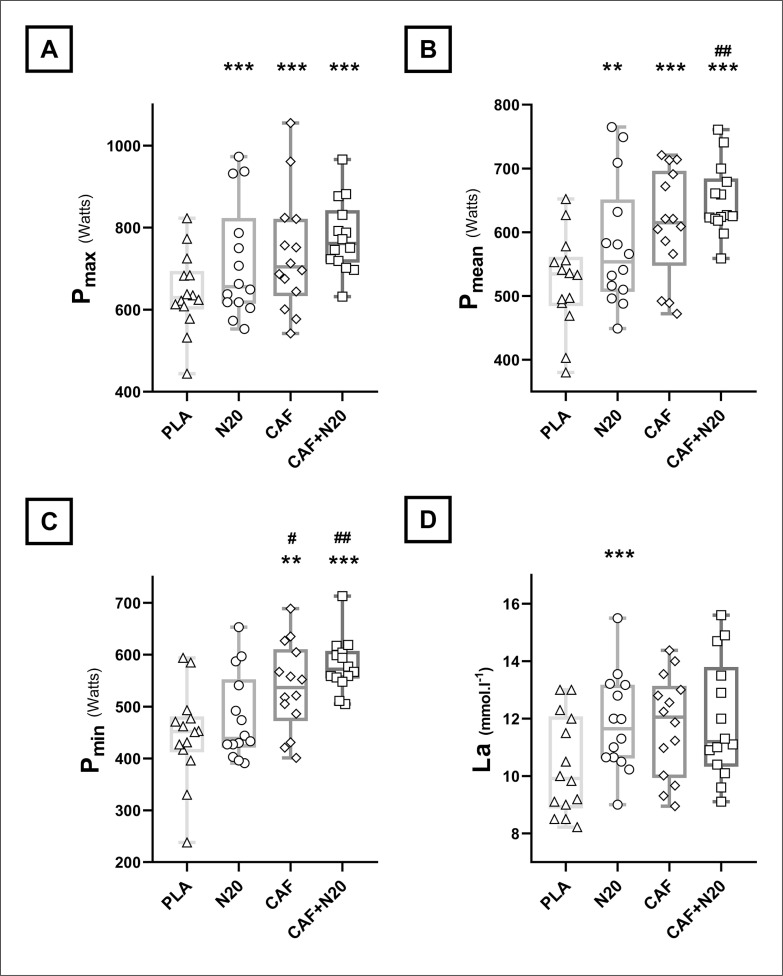
FIG. 2.
Group means and standard deviation with individual values of maximum (Pmax; A), mean (Pmean; B) and minimum (Pmin; C) powers and plasma lactate concentrations [La; D] after different protocol sessions.
Note: PLA: placebo, N20: 20 min nap opportunity with placebo ingestion, CAF: 5 mg · kg-1 of caffeine and CAF+N20: 5 mg · kg-1 of caffeine + 20 min nap opportunity. *, ** and *** indicate a significant difference in comparison with PLA session at p < 0.05, p < 0.01 and p < 0.001, respectively; #, ## and ### indicate a significant difference in comparison with N20 values at p < 0.05, p < 0.01 and p < 0.001, respectively.

