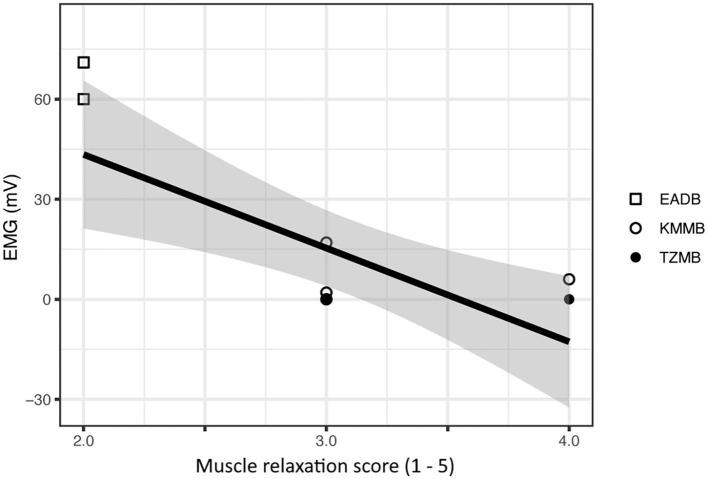
Figure 1.
Comparison of subjective muscle relaxation scoring and electromyography (EMG) measurements for treatment group 1 (KMMB), treatment group 2 (TZMB) and the control group (EADB). The figure presents a significant negative correlation where higher EMG values seen in the control group show low subjective muscle relaxation scores and subsequently lower EMG values that correspond to a higher subjective muscle relaxation score in the treatment groups.

