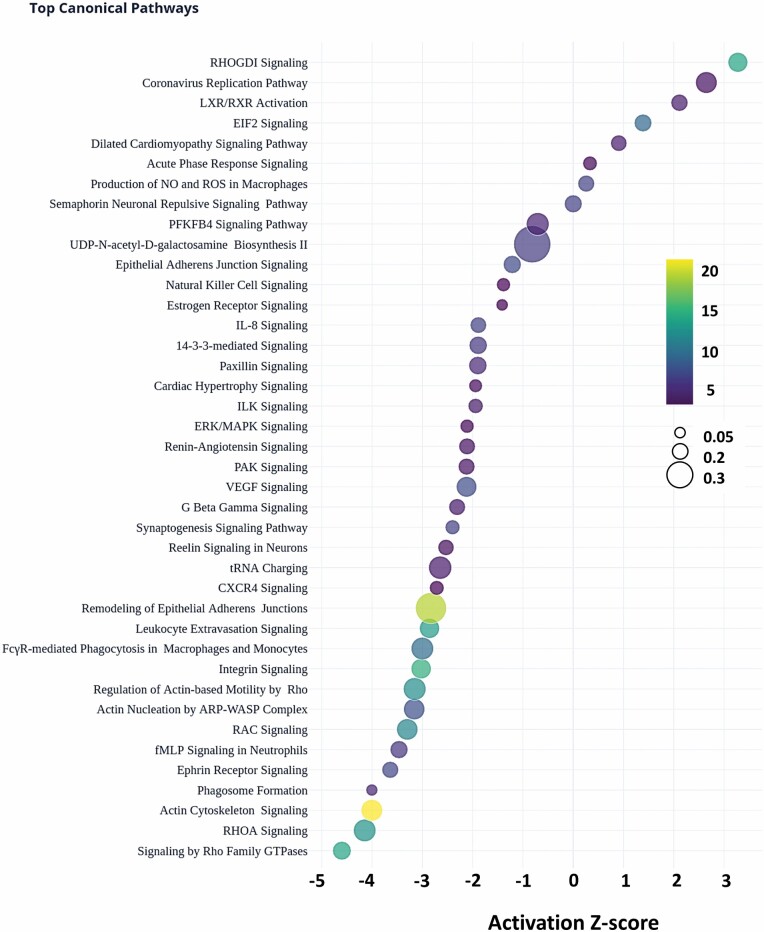
Figure 2.
Top canonical pathways in the older adults. Top 40 canonical pathways of the DEPs. Pathway activation Z-scores, an inferred measurement of the pathway activation stated based on measured levels and IPA knowledge, is shown by bubble position on the x-axis (−4.146 to 3.273), Pathway name on the y-axis, -log-transformed p-values (color scale, blue-to-yellow, 4.02–22.8), and ratio (DEPs in data set belonging to pathway/proteins in the pathway for reference data set, bubble size, small-to-big, 0.0479–0.462).

