Figure 1.

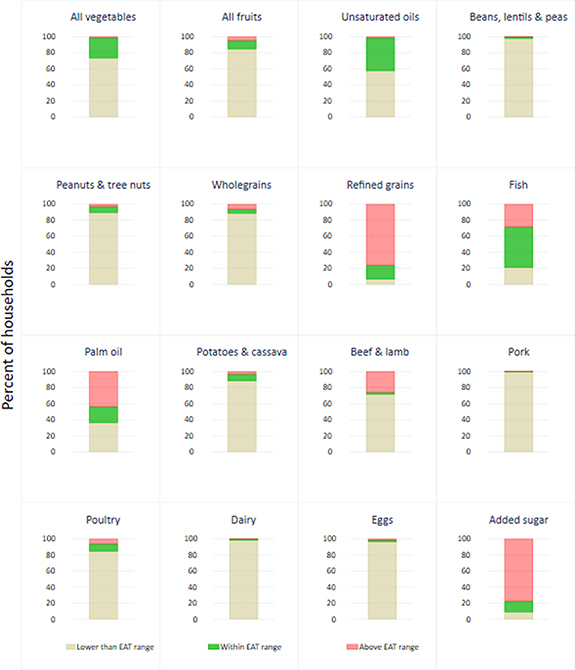
Comparison of mean household food group consumption with EAT-Lancet ranges [Recommended ranges are according to Method 1 with minimum values as described in the ‘intake range’ column of table 1].

Comparison of mean household food group consumption with EAT-Lancet ranges [Recommended ranges are according to Method 1 with minimum values as described in the ‘intake range’ column of table 1].