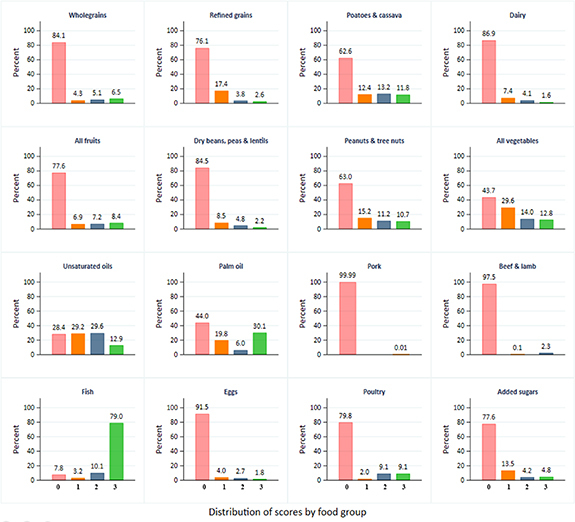
Figure 2.

Distribution of scores obtained on each of the 16 food groups [Scores 1, 2 and 3 generally refer to consumption within acceptable limits of a food group. A 0 score generally means consumption outside acceptable limits for a food group (details in table 1). Scores 0, 1, 2 & 3 are shown by light shades of red, orange, blue and green respectively. Scores with 0% households are not shown].
