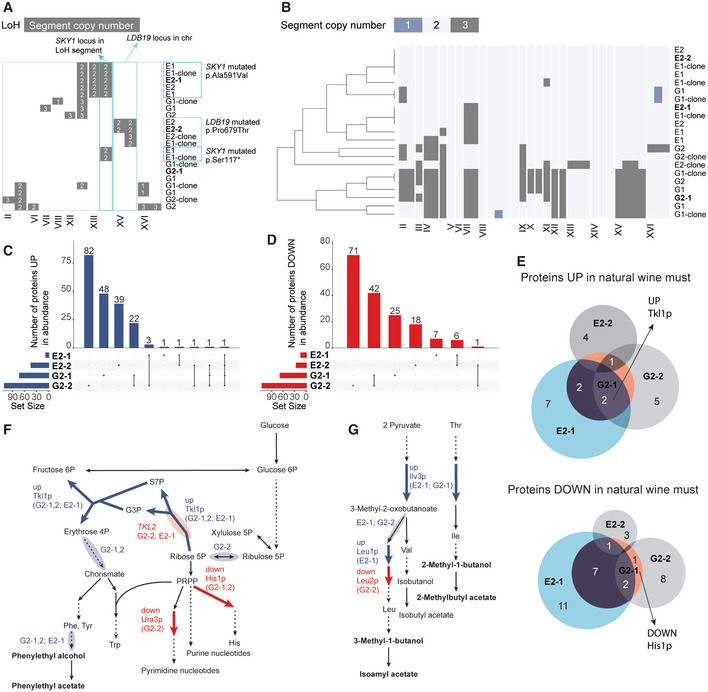
Loss‐of‐heterozygosity (LoH) coincided with single nucleotide variants (SNVs, marked on the top and right side of the panel) in evolved populations and clones from the ethanol environment, suggesting the necessity of the SNVs being homozygous for the evolved phenotype. The evolved clones (“‐clone”) and populations are named according to their selection environment: “G”—glycerol selection environment. “E”—ethanol selection environment. The number after the letter stands for the evolution status: 1—the time of first isolation of clones, 2—the time of second isolation of clones. The clones for which we determined protein and transcript alterations are indicated in bold.
Evolved populations and clones from the glycerol environment exhibited large copy number variations. Shown are the genome segment copy numbers along the chromosomes (chr). Vertical lines mark ends of contigs.
Upset plot of sets of proteins higher in abundance (limma, n = 3 (biological replicates), P value < 0.01, −1 > log2fc > 1) in the evolved isolates than in the parental strain in the respective evolution environments (G1‐2, G2‐2: glycerol environment; E1‐2, E2‐2 ethanol environment) shows partly shared solutions underlying improved fitness.
Upset plot of sets of proteins lower in abundance (limma, n = 3 (biological replicates), P value < 0.01, −1 > log2fc > 1) in the evolved isolates than in the parental strain in the respective evolution environments (G1‐2, G2‐2: glycerol environment; E1‐2, E2‐2 ethanol environment) shows proportionally large overlaps between the isolates evolved in the same environment.
The evolved clones fermenting natural wine must (application environment) revealed both shared and evolution environment‐specific protein abundance changes up and down in comparison to the parental strain (limma, n = 3 (biological replicates), P value < 0.01, −1 > log2fc > 1). Clones for which we quantified the aroma production are shown in color (E2‐1 in light blue, G2‐1 in orange). Clones from the glycerol environment (G2‐1, G2‐2) featured higher abundance of Tkl1p (transketolase) and lower abundance of His1p (ATP phosphoribosyltransferase).
Changes in protein (limma; n = 3 (biological replicates), P value < 0.01, −1 > log2fc > 1) and transcript abundances (Wald test; n = 3 (biological replicates), fdr < 0.05, −1 > log2fc > 1) are centered on the pathways leading to the target aroma compounds phenylethyl alcohol and phenylethyl acetate. The changes consistent with the model predictions are indicated with colored arrows (protein‐level) and clouds around the arrows (transcript‐level).
Proteomic and transcriptomic changes in evolved clones, marked as in (F), for pathways leading to the branched chain amino acid‐derived target aroma compounds.

