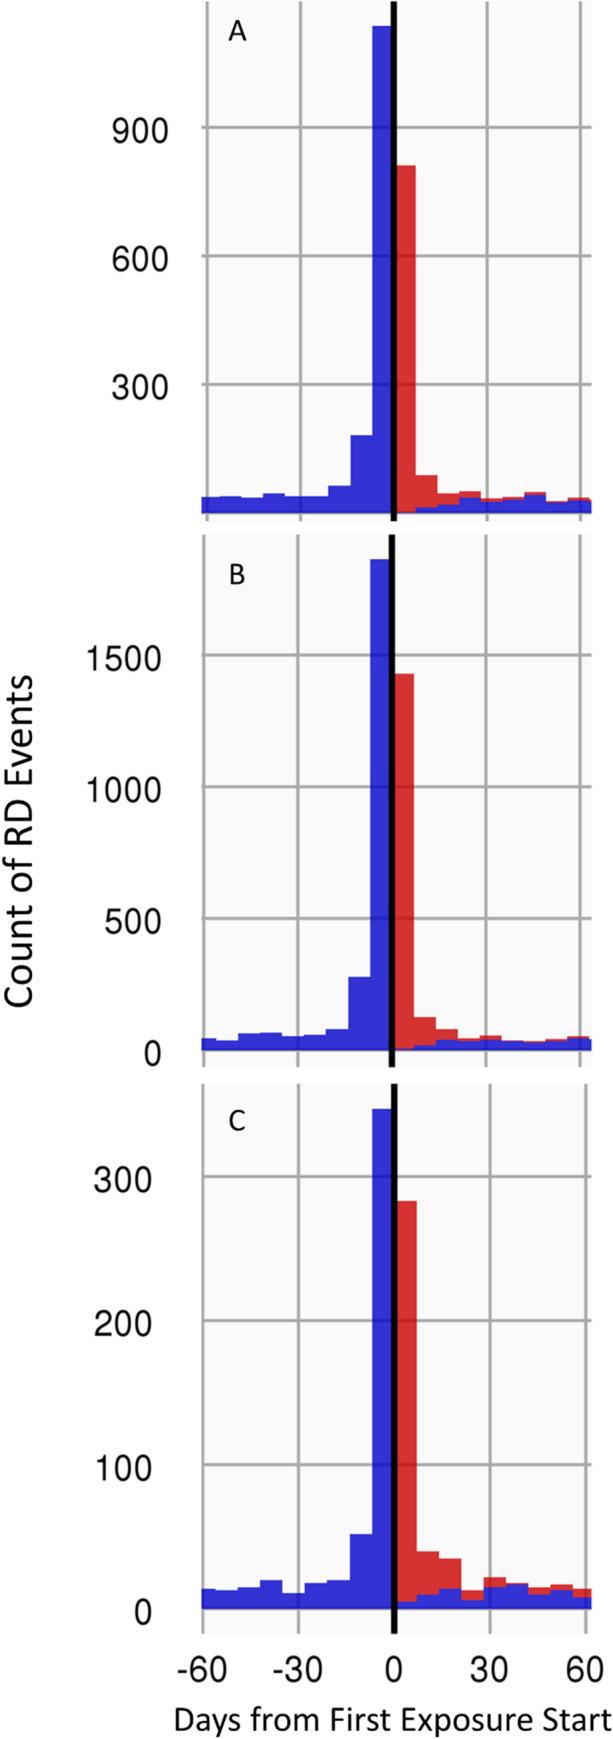
Fig 2. Timeline of RD Events, in each database, from 60 days before to 60 days after first FQ exposure.

FQ exposure included all types of formulations. Red bars indicate that events occurred concurrently with the FQ risk window, whereas blue bars indicate event occurrences outside of the risk window. A spike of RD events was observed prior to the first day of FQ exposure. 2A: Exposure timeline in OPTUMEXTDOD; 2B: Exposure timeline in IBMCOM; 2C: Exposure timeline in IBMMDCR.
