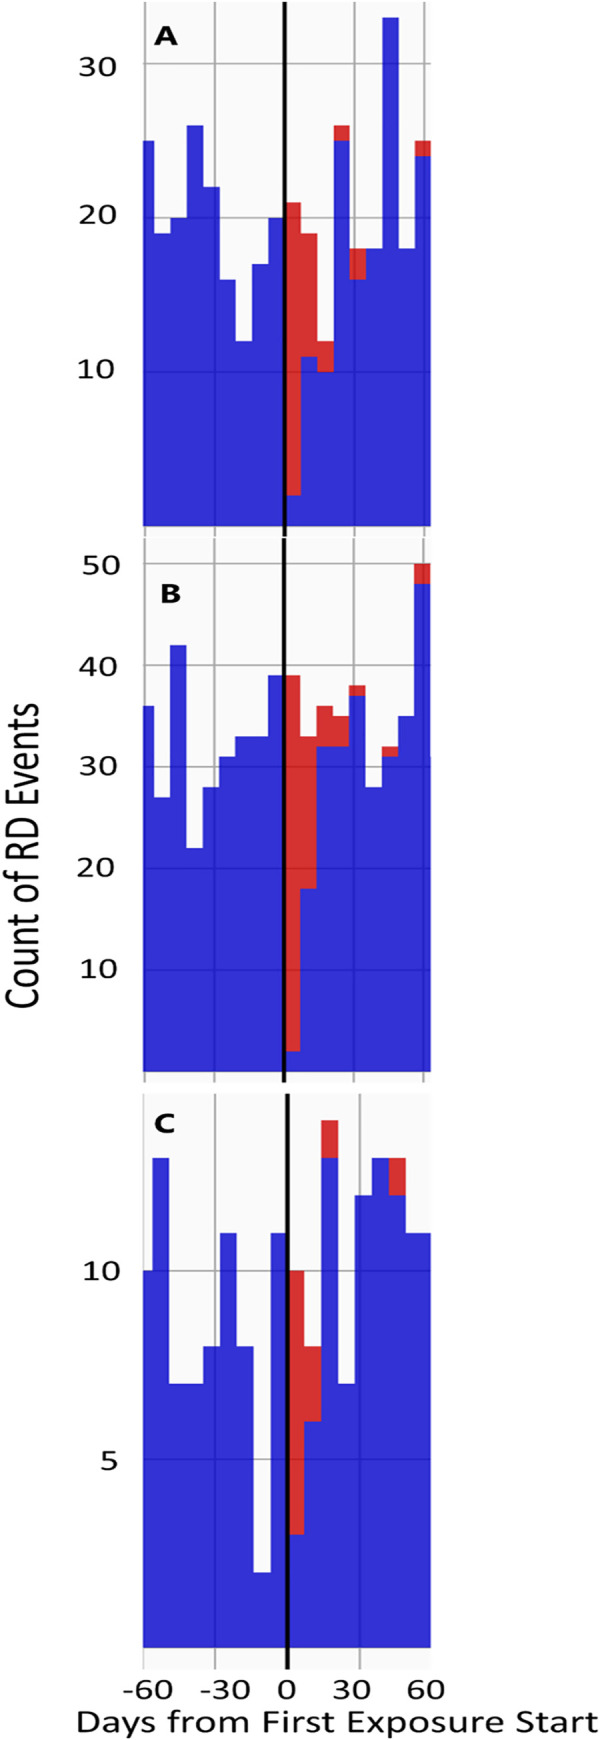
Fig 3. Timeline of RD Events, in each database, from 60 days before to 60 days after first FQ exposure.

FQ exposure included oral tablets only. Red bars indicate that events occurred concurrently with the FQ risk window, whereas blue bars indicate event occurrences outside of the risk window. 3A: Exposure timeline in OPTUMEXTDOD; 3B: Exposure timeline in IBMCOM; 3C: Exposure timeline in IBMMDCR. In contrast to Fig 2, there is no exposure peak in the days just before the retinal detachment. RD events were randomly distributed before and after the first date of FQ exposure.
