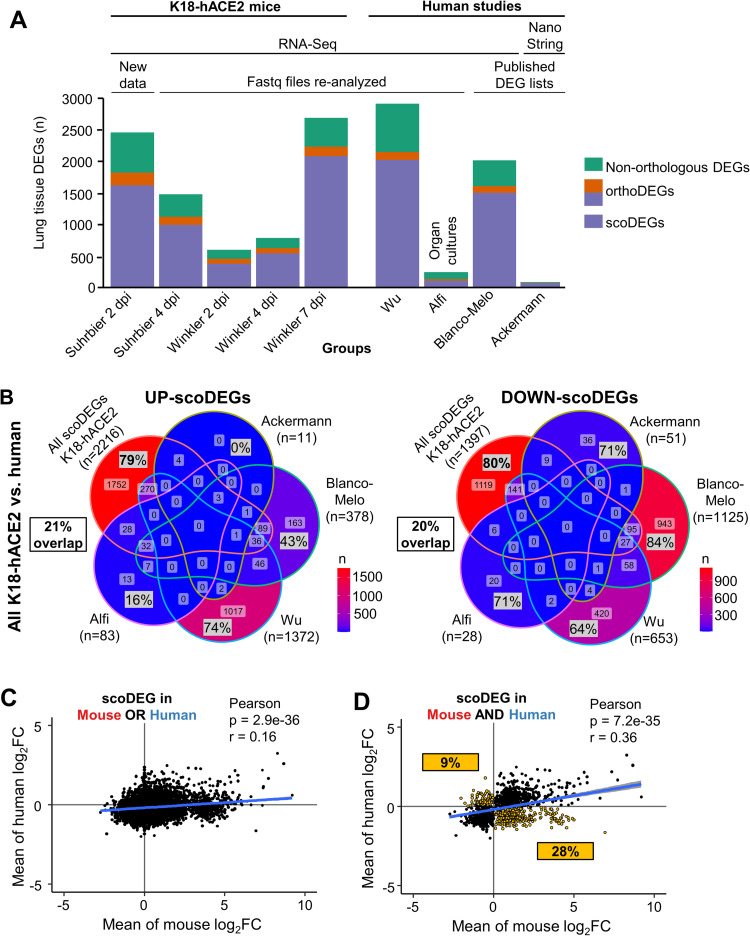
Fig 1. Mouse and human DEGs; overlaps and concordances between species.
(A) DEGs from lungs/lung tissues infected with SARS-CoV-2 were identified in K18-hACE2 mouse and human studies (n = number of DEGs). DEGs were generated from original RNA-Seq data provided herein (New Data), re-analyzed from previously published RNA-Seq data (Fastq files re-analyzed), or were obtained from publications (published DEG lists). All datasets were derived from RNA-Seq, except Ackerman which was obtained from a Nanostring study. Coloring of bars: Green—non-orthologous between mouse and human; Orange—with one or both species having multiple orthologues; Purple—both species having a single copy orthologue. A total of 9 Groups (5 K18-hACE2 and 4 human) were considered in the subsequent analyses. (B) The union of all K18-hACE2 scoDEGs was used to compare mouse and human for up- and down-regulated scoDEGs. ‘n’ refers to the number of scoDEGs for each group. Percentages within the Venn diagram (gray boxes) show the percentage of scoDEGs exclusive to that group (i.e. a scoDEG in that group but no other group. E.g. 1752/2216 x 100 = 79%). The boxed overlap percentages represent the percentage of mouse scoDEGs that are also scoDEGs in one or more human studies (e.g. 2216-1752/2216 x 100 ≈ 21% for up-regulated scoDEGS and 1119-1397/1397 x100 ≈20% for down-regulated scoDEGs). (C) Pearson correlation of mean log2FCs of single-copy orthologues that were DEGs in either any mouse group or any human group or both. (D) Pearson correlation of mean log2FCs of single-copy orthologues that were DEGs in both one or more mouse groups and one or more human groups. scoDEGs that had inconsistent mean expression between species (i.e. were upregulated in one species and down-regulated in another) are shown yellow. The percentage of scoDEGs with inconsistent expression (yellow boxes) is provided relative to the total number of scoDEGs.

