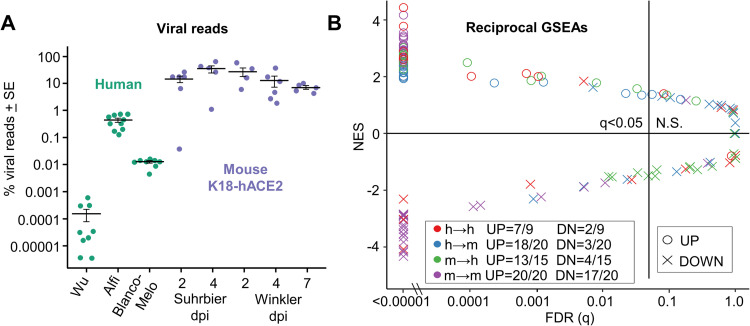
Fig 2. Viral reads and reciprocal GSEAs.
(A) For each sample, the number of reads aligned to the SARS-CoV-2 genome are shown as a percentage of the total number of reads that align to all protein coding genes (filled circles). Cross-bars represent the mean for each group. (B) Pairwise reciprocal GSEAs showing enrichment of up- or down-regulated orthoDEG sets in log2FC ranked gene lists for all possible pair-wise comparisons between groups (i.e. 128 combinations; 3 human and 5 mouse ranked gene lists vs. 4 human and 5 mouse orthoDEG lists). Circles and crosses are colored according to direction of the GSEA (e.g. green = mouse orthoDEG sets vs. ranked human gene lists). Fractions show the proportion of orthoDEG sets that are significantly enriched with consistent directionality (e.g. “UP = 13/15” indicates that, of 15 GSEAs using up-regulated orthoDEG sets, 13 showed significant enrichment with positive NES).

