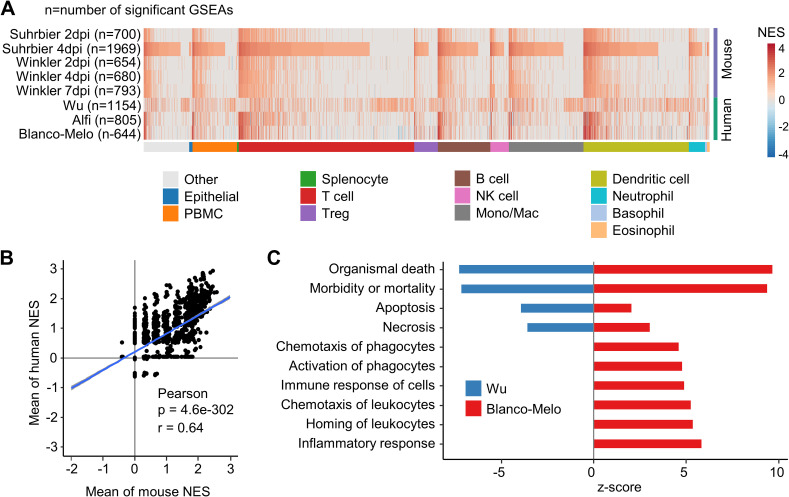
Fig 3. Gene Set Enrichment Analysis using immune-cell gene sets.
(A) Gene sets from the GSEA Immune Signatures Database (ImmuneSigDB) were used to interrogate log2FC ranked gene lists from all groups. A total of 2879 GSEAs were significantly enriched in at least one group, and were clustered according to the cell-type mentioned in the annotation for the gene set. Within each cell-type cluster, gene sets were ranked according NES for Suhrbier 4 dpi. (B) Pearson’s correlation of mean mouse NES for 2879 ImmuneSigDB gene sets vs. the mean human NES for the same gene sets. (C) The full DEG lists for Wu and Blanco-Melo were analyzed by IPA Diseases and Functions. The top 10 annotations that had the greatest differences in z-scores between Wu and Blanco-Melo are shown, ranked by difference. A z-score of 0 means the annotation was not identified as significant by IPA.

