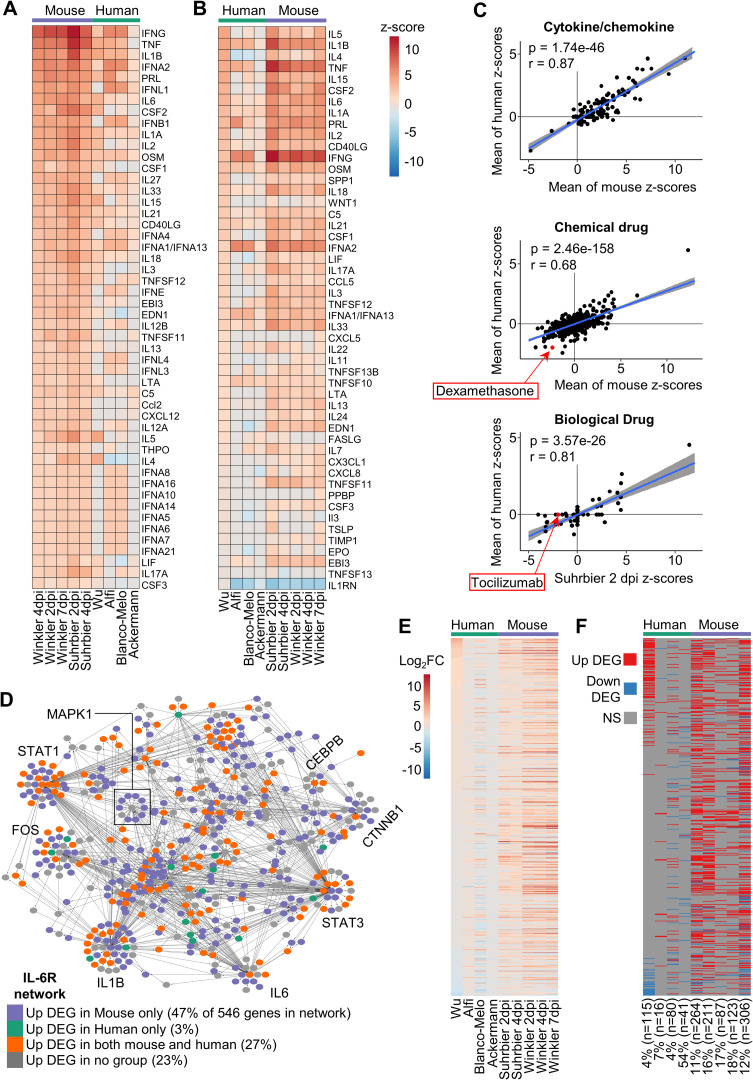
Fig 4. Cytokine/chemokine and drug IPA USR concordances between human and K18-hACE2 mice.
(A) DEGs from each group were analyzed by the upstream regulator (USR) feature of IPA. The heatmap shows the top 50 of cytokine/chemokine USRs ranked by activation z-scores from the Winkler 4 dpi data. (B) Heatmap comparing groups as in A, except ranked according to z-score from the Wu data. (C) Cytokine/chemokine–Pearson correlation of mean mouse z-scores vs. mean human z-scores for significant Cytokine/chemokine USRs (n = 146). Chemical drugs–Pearson correlation of mean mouse z-scores vs. mean human z-scores for significant Chemical drug USRs (n = 1156). Biologic drugs—Pearson correlation of mean mouse z-scores vs. mean human z-scores for significant chemical drug USRs (n = 109). For calculating means, non-significant USRs were given a value of zero, thus means were derived from n = 5 for mouse groups and n = 4 for human groups. (D) Network of 546 genes associated with IL-6R signaling according to IPA. Node color indicates whether a gene was up-regulated only in mouse (purple; ≥1 mouse group, and no human group), only in human (green; ≥1 human group, and no mouse group), both (orange; ≥1 mouse and ≥1 human group), or not up-regulated in any group (grey). Large sub-networks are labeled according to their hub node. (E) Heatmap comparing groups according to log2 fold-change (log2FC) of 546 genes associated with the IL-6R signaling network. Genes are ranked according to log2FC in Wu. (F) Categorical “heatmap” with groups (x axis) and genes (y axis) as in E, with up-regulated DEGs shown in red, down-regulated DEGs in blue, and genes whose expression was not significantly different (NS) in grey. The percentage and number of DEGs in each group that are present in the IL-6R network is indicated; e.g. The Wu data set has 2875 DEGs, of which 4% (115) are present in the IL6R network.

