Fig 6.
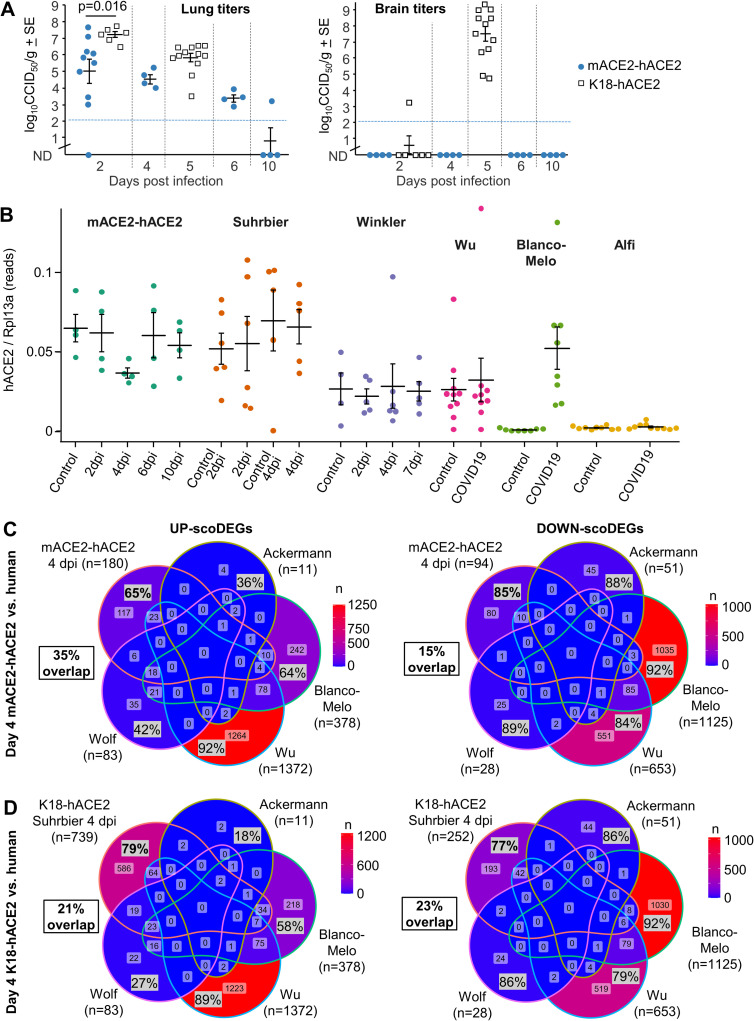
The mACE2-hACE2 mouse model (A) Lung and brain viral tissue titers at the indicated days post infection. All infected K18-hACE2 mice reach ethically defined endpoints for euthanasia (weight loss ≥20%) by day 5. None of the mACE-hACE2 mice reach ethically defined endpoints for euthanasia. Mean lung titers on day 2 were 2.2 log10CCID50 lower in mACE2-hACE2 mice compared to (Suhrbier) K18-hACE2 mice (p = 0.016, Kolmogorov-Smirnov test). (B) hACE2 reads normalized to Rpl13a reads for all mACE2-hACE2, K18-hACE2 and human lung samples. Cross-bars represent group means ± standard error. (C) Venn-diagrams show overlap in up- and down-regulated scoDEGs between mACE2-hACE2 4 dpi mice and the four human groups. Percentages within the Venn diagram (grey boxes) show the percentage of scoDEGs exclusive to that group (i.e. a scoDEG in that group, but in no other group). The boxed overlap percentages represent the percentage of 4 dpi mouse scoDEGs that are also scoDEGs in one or more human studies (e.g. 180-117/180 x 100 ≈ 35% for up-regulated scoDEGS and 94-80/94 x100 ≈15% for down-regulated scoDEGs). (D) As for C showing overlaps in up- and down-regulated scoDEGs between K18-hACE2 Suhrbier 4 dpi and the four human groups. Percentages as in C.

