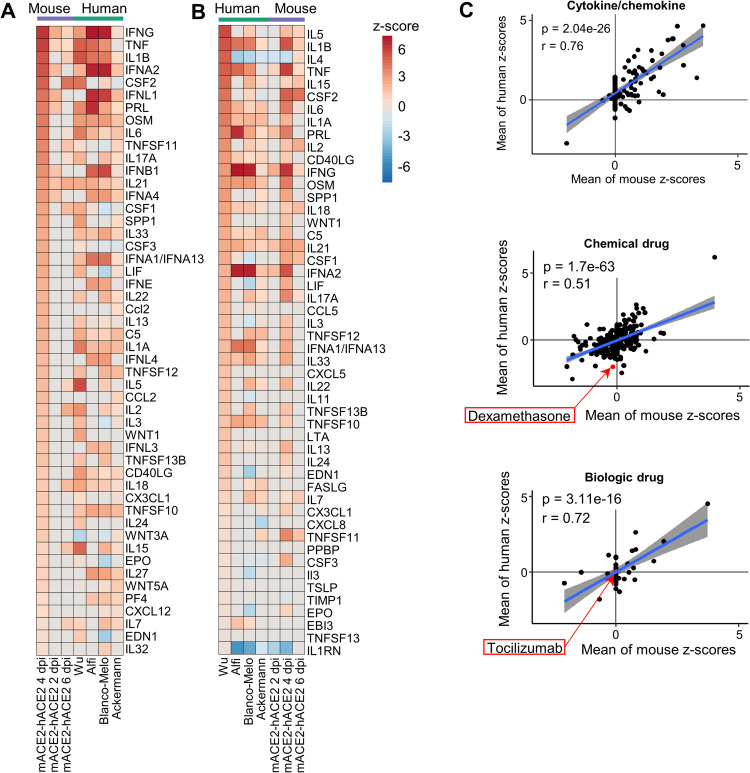
Fig 7. Cytokine/chemokine and drug USR concordances between mACE2-hACE2 mice and humans.
(A) Heatmap comparing mACE2-hACE2 mouse groups with human groups for IPA cytokine/chemokine USRs ranked by activation z-score in mACE2-hACE2 4 dpi. (B) Heatmap comparing groups as in A, except ranked according to z-score in Wu, as a representative of human groups. (C) Pearson correlation of mean mouse vs. mean human z-scores for significantly enriched cytokine/chemokine USRs (n = 136), chemical drug USRs (n = 959) and biologic drug USRs (n = 94). Blue line shows linear regression with 95% confidence intervals (grey).

