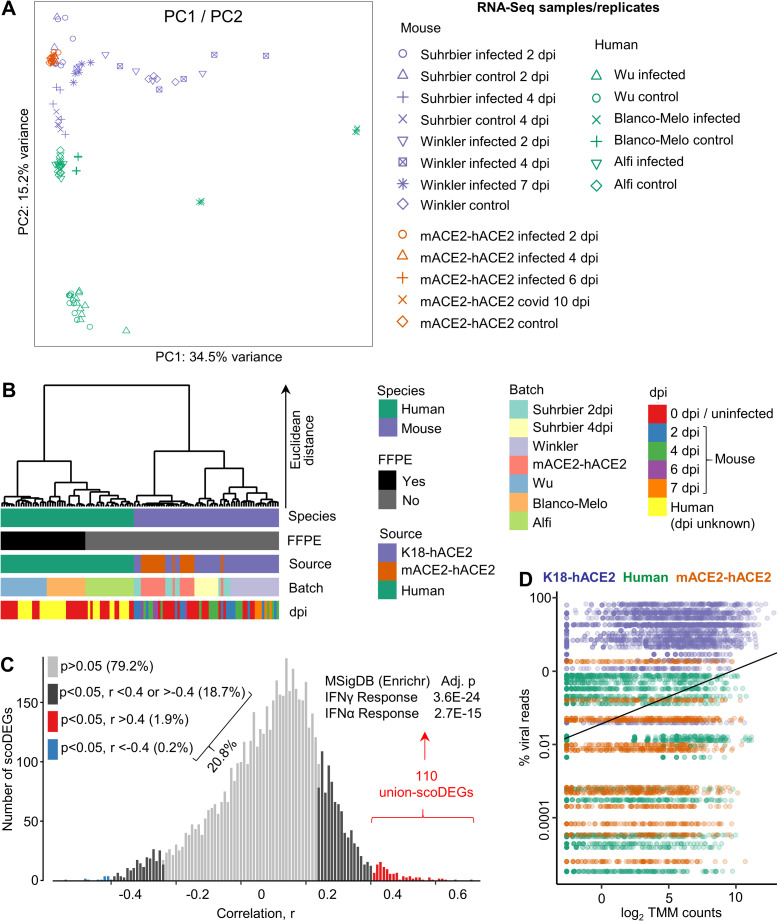
Fig 8. Principal component, hierarchical cluster and viral load analyses.
(A) Scatter plots showing principal component 1 (PC1) vs. PC2 derived from 14,918 single-copy orthologues from all samples/accessions. Read counts were TMM-normalized and log2-transformed. Expression values were calculated by subtracting each TMM-log2 count from the row mean of all samples for each gene (i.e. deviation from row mean). (B) Hierarchical cluster analysis using the top 500 orthologues according to PC1 and PC2 loadings as in A. Clustering distance was Euclidean, and clustering method was Ward’s linkage. FFPE = Formalin-fixed, paraffin-embedded. (C) For all union-scoDEGs (a sco-DEG in at least 1 sample, n = 5880), across all samples/accessions (n = 69), Pearson correlations were undertaken comparing gene expression (log2 TMM normalized read count for each scoDEG) with percent viral reads (viral read count as a percentage of all read counts for host protein coding genes). Significance (p) and correlation (r) were generated for all scoDEGs. A histogram showing distribution of r values is shown, with colors indicating p and r cutoffs. The 110 genes that correlated well (red) were analyzed using the Molecular Signatures Data Base (MSigDB) available online via Enrichr, with the top 2 annotations shown. (D) The percent viral reads for the 69 samples/accessions are shown on the y axis, and were plotted against expression (log2 TMM counts) of the 110 genes in C. As expected, as correlating union-scoDEGs were selected from D (red), a significant correlation emerged when all 110 union-scoDEGs are taken together; linear regression (black line), p = 2.02 x 10E-149, r = 0.29.

