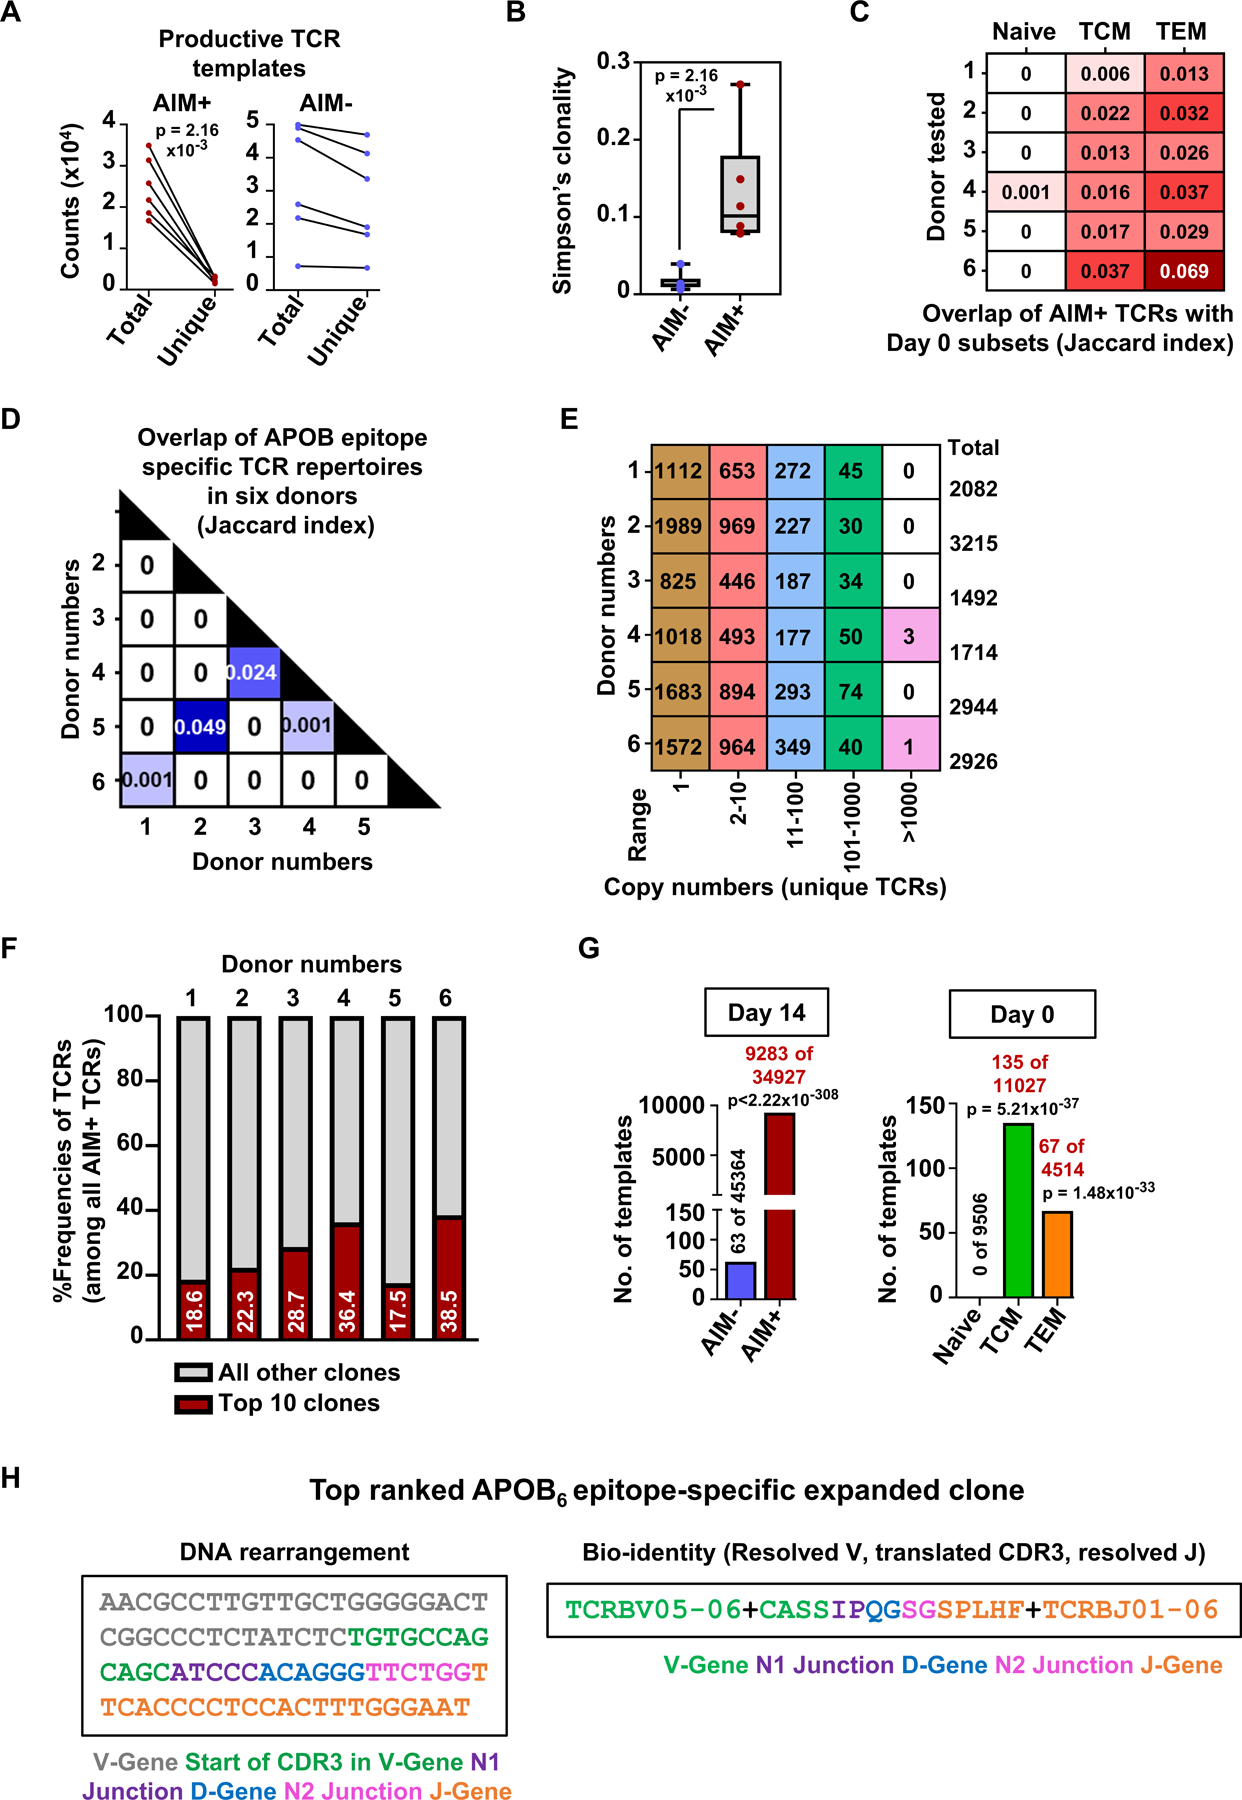
Figure 4: APOB-derived dominant epitopes trigger expansion and activation of an oligoclonal population of CD4+T cells in human PBMCs.

A) Counts of total and unique productive (in-frame for protein translation) TCR templates identified in control AIM− and APOB6-specific AIM+ CD4+T cells. Y-axis: counts x 104. B) Box plots showing Simpson’s clonality index measured for AIM− and AIM+ productive TCRβ sequences. C) Comparison of repertoire overlap between AIM+ productive TCRs and those from naïve or TCM or TEM subsets. Values denote the Jaccard index, a statistical measurement of similarity between sample sets. Rows represent data from individual donors. D) Matrix showing TCR repertoire overlap across donor-specific AIM+ productive TCRs E) Total numbers of unique productive TCR clones identified in AIM+ CD4+ T cells from individual donors (rows) and are present within a specific range of copy numbers (columns). F) Red bars and values showing the cumulative %frequencies of the top 10 most abundant rearrangements of all productive TCRs detected in AIM+ cells in each donor. Grey shaded areas represent the combined frequencies of all other clones. Six independent donors (A-F). G) Template copy numbers of the top-expanded clone (detected in Donor 6) in different sorted CD4+ T populations. Total numbers of productive TCR templates in AIM− and AIM+ subsets (Day 14) and in naïve, TCM and TEM lineages (Day 0) are also indicated. H) Nucleotide sequence and bio-identity of the top-ranked APOB6-specific TCR rearrangement. Details of the rearrangement are color coded by component. Colored symbols represent data from individual donors. Statistical comparisons between total and unique TCR counts (A) and Simpson’s clonality in AIM- and AIM+ populations (B) were performed using Mann-Whitney test. Statistical comparisons of specific TCR clonal frequencies in AIM− vs AIM+ cells and in naïve vs TCM or naïve vs TEM populations (G) were performed using Fisher’s exact test.
