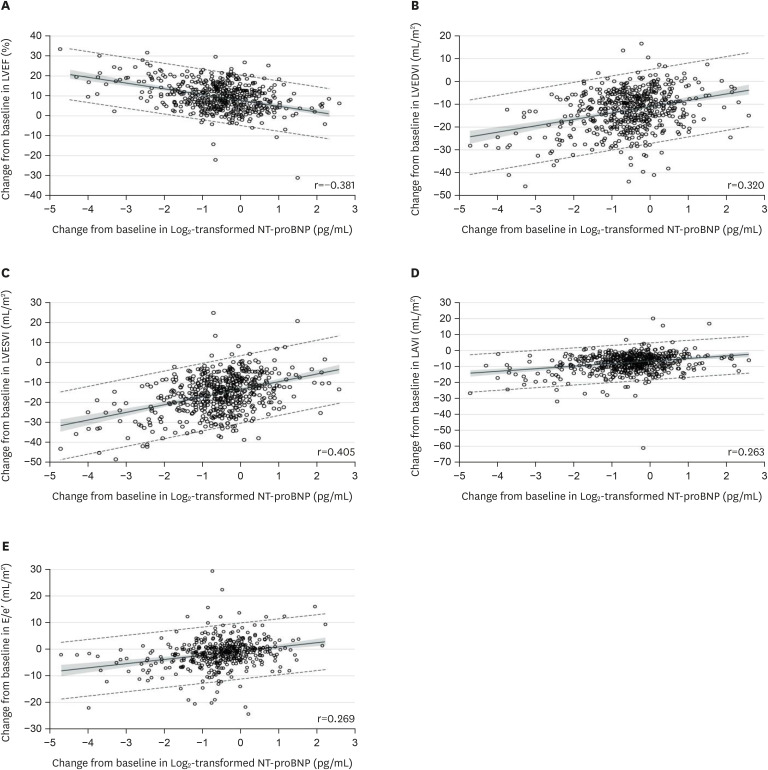
Figure 4. Association between changes in LV structure and NT-proBNP levels in PROVE-HF. Scatterplots detailing correlations between baseline and 12-month concentrations of Log2-transformed NT-proBNP and contemporaneous change in LVEF, LVEDVI, LVESVI, LAVI, and E/e′. A mean regression line is detailed with 95% prediction limits demonstrated in dashed lines. The shaded regions indicate 95% confidence limits. Data from reference 37 with permission.
LV = left ventricular; LVEF = left ventricular ejection fraction; LVEDVI = left ventricular end-diastolic volume index; LVESVI = left ventricular end-systolic volume index; LAVI = left atrial volume index; NT-proBNP = N-terminal pro-B-type natriuretic peptide.

