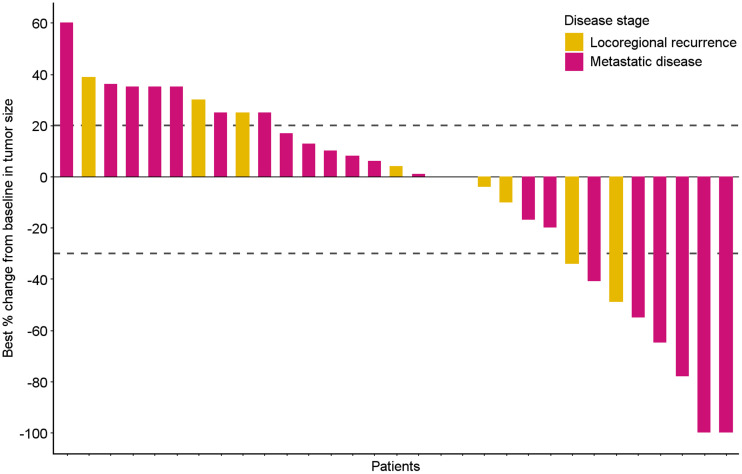
FIGURE 1.
Each bar of waterfall plot depicts best response according to RECIST, version 1.1, of single patient during durvalumab treatment. Blue bars represent patients with metastatic disease, pink bars patients with locoregional recurrent disease. Dotted lines reflect RECIST for disease progression (+20% change) and partial response (−30%).

