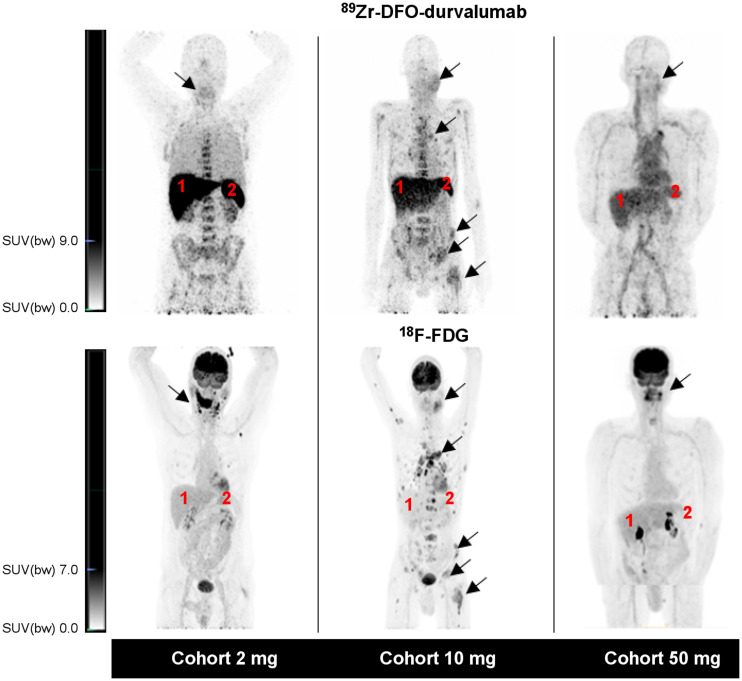
FIGURE 2.
Representative example images of 1 patient per dose cohort. For each cohort, 89Zr-DFO-durvalumab PET/CT (top) and 18F-FDG PET/CT (bottom) are presented. Physiologic 89Zr-DFO-durvalumab is visualized in lymphoid organs (e.g., liver [1], spleen [2]). Arrows identify tumor lesions. SUV(bw) = SUV based on body weight.

