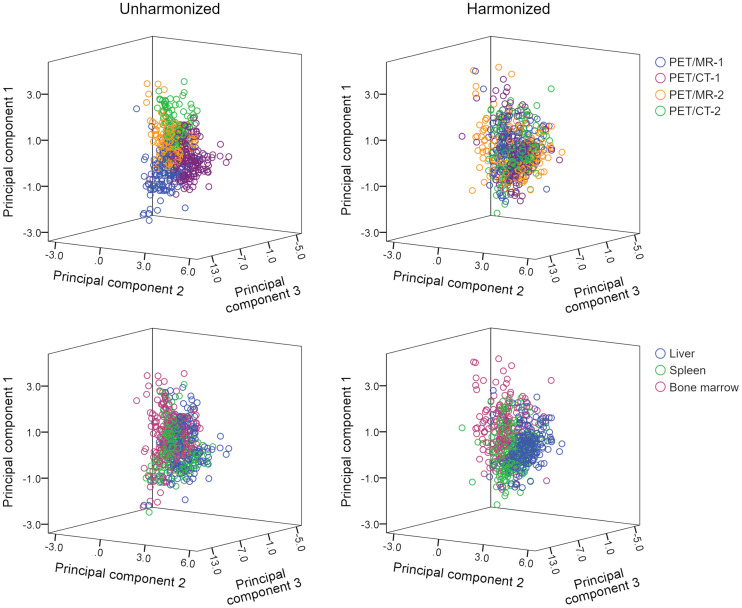
FIGURE 3.
Three-dimensional scatterplots showing obvious scanner-specific clustering within unharmonized dataset, which is decreased or resolved in harmonized dataset. Conversely, clustering according to tissue type (liver, spleen, and bone marrow) is improved in harmonized dataset; in particular, liver cluster (blue) is now clearly visible.

