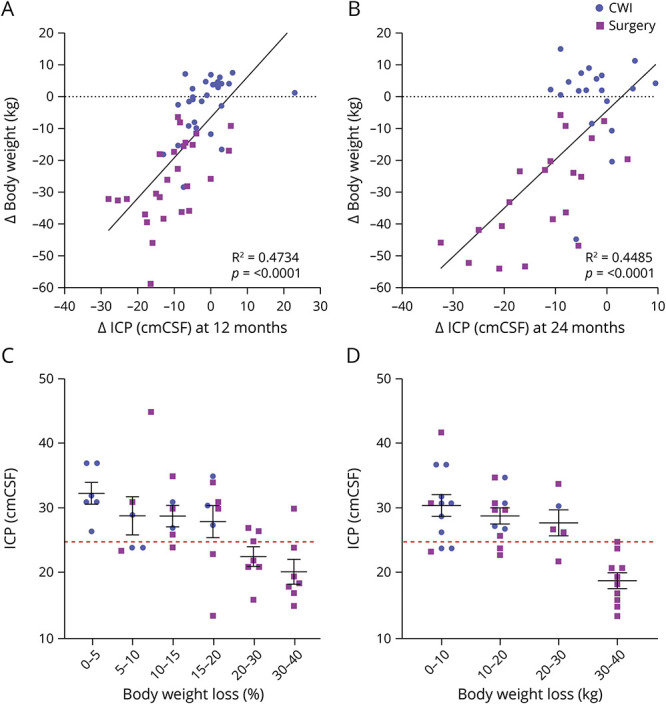
Figure 1. Reduced Body Weight Significantly Correlates With Reduced ICP.

(A, B) Linear regression analysis plotting change in body weight against change in ICP at 12 and 24 months postbaseline. (C, D) ICP levels of patients categorized according to percentage and absolute weight loss at 12 months since baseline measurements. The dashed red line indicates the idiopathic intracranial hypertension diagnostic threshold of an ICP >25 cmCSF. Data presented as mean ± SEM. Statistical significance was determined by ordinary 1-way analysis of variance with the Tukey multiple comparisons test. CWI = community weight management intervention; ICP = intracranial pressure.
