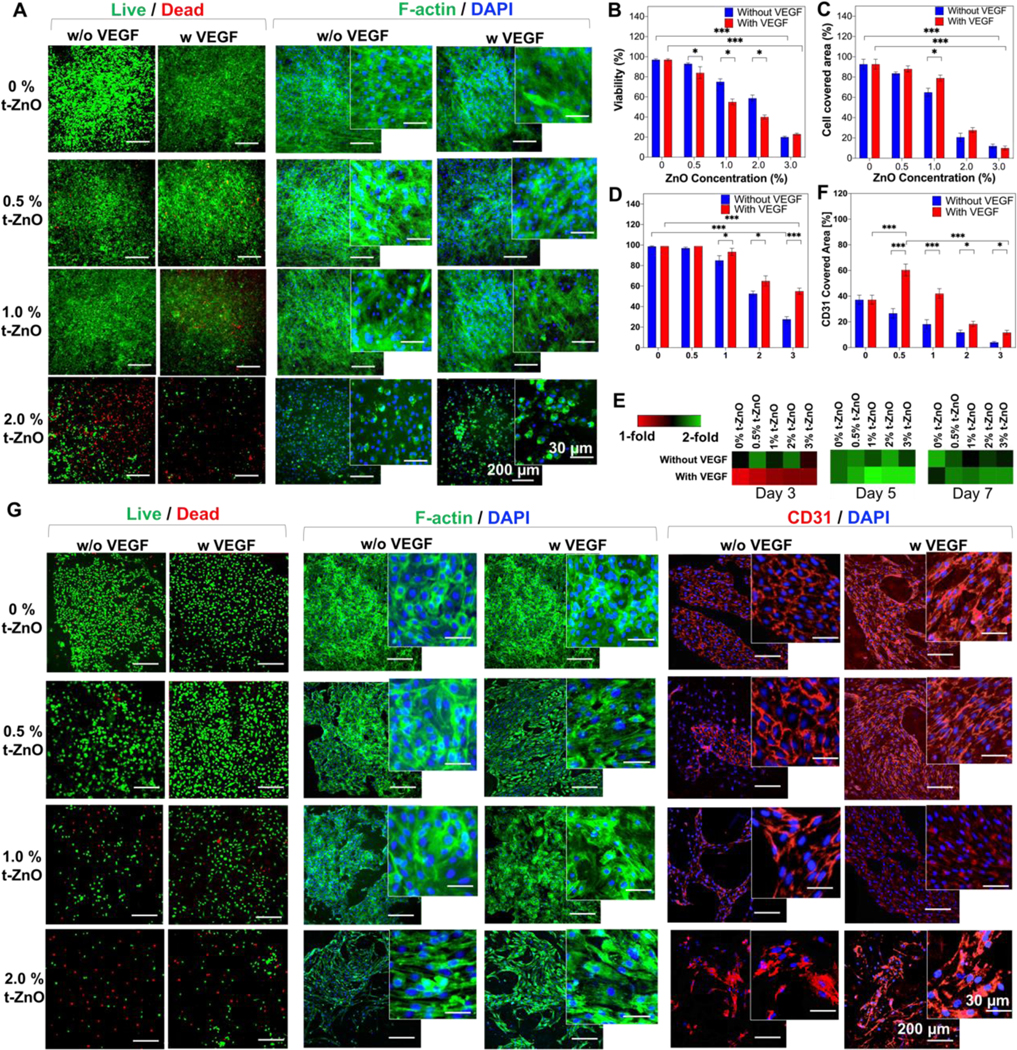
Figure 4. In vitro characterization of VEGF-coated t-ZnO GelMA hydrogels.

(A) Live/Dead and F-Actin/DAPI staining on C2C12 behaviors cultured on the t-ZnO-laden GelMA hydrogels with and without VEGF coating at various concentrations of t-ZnO. (Β) Quantified viability of cultured C2C12 cells on the constructs with and without VEGF coating and different concentrations of t-ZnO. (n = 3, 2 random images/sample, *p < 0.05, ***p < 0.001). (C) Quantified cell covered area that was calculated from F-Actin/DAPI staining images of cultured C2C12 cells on the t-ZnO-laden GelMA hydrogels obtained on day 3 of culture. (n = 3, 2 random images/sample, *p < 0.05, ***p < 0.001). (D) Quantified viability of cultured HUVECs on the t-ZnO-laden GelMA hydrogels with and without VEGF coating at various concentrations of t-ZnO on day 1 of culture. (E) PrestoBlue™ assay of HUVECs seeded on different concentrations of t-ZnO and t-ZnO VEGF-coated hydrogels over 7 days of culture. (n = 3). (F) Higher CD31 covered area observed on VEGF-coated t-ZnO-laden GelMA hydrogels which were calculated from CD31/DAPI staining images obtained on day 7 of culture. (n = 5, *p < 0.05, ***p < 0.001). (G) Representative fluorescence microscope images of live/dead, F-Actin/DAPI, and CD31/DAPI staining for cultured HUVECs on t-ZnO-laden GelMA hydrogels with and without VEGF coating at various concentrations of t-ZnO on day 7 of culture.
