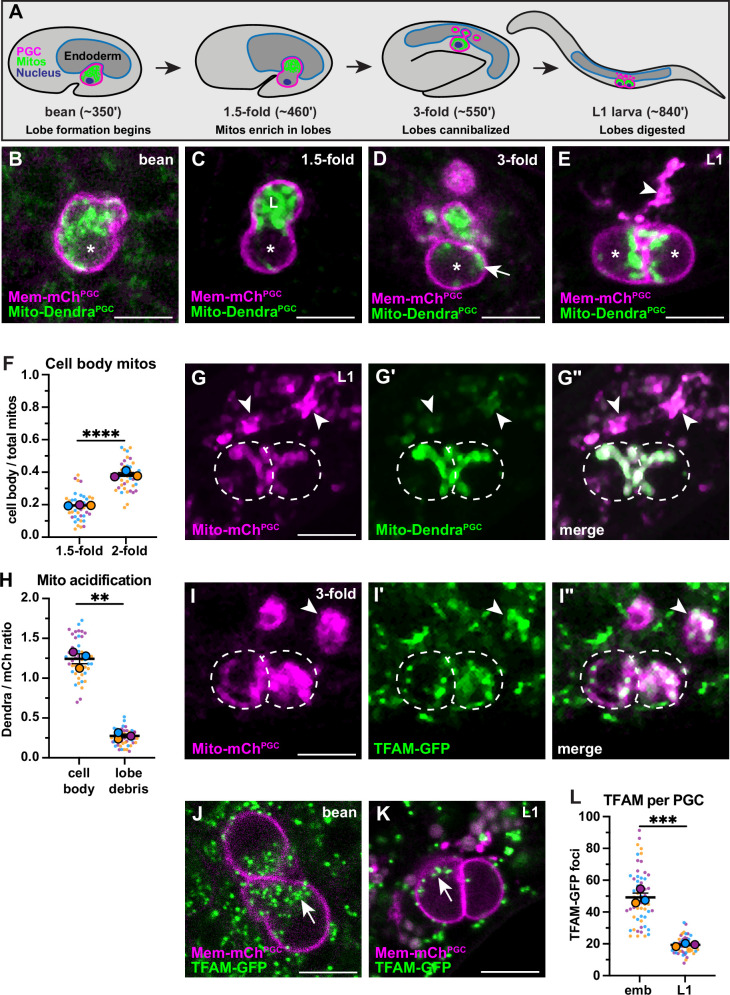
Figure 1. Primordial germ cell (PGC) lobe mitochondria and mitochondrial DNAs (mtDNAs) are cannibalized and digested.
(A) Schematic of PGC lobe formation and cannibalism. Bean stage to threefold embryos, one PGC visible; L1 larva, both PGCs visible. PGCs (magenta), PGC mitochondria (green), and endoderm (blue) are shown. Developmental timepoints are shown as approximate time in minutes post-fertilization at 20–22°C. (B–E) Plasma membranes and mitochondria in embryonic PGCs just as lobes form (B), in PGCs with lobes (C–D), and in L1 larval PGCs after lobes are digested (E; arrowhead, lobe debris in endoderm). *, nucleus; ‘L’, lobe. (F) Quantification of the mitochondrial fraction within the cell body in 1.5-fold and 2-fold stage PGCs. (G-G”) Acidified mitochondria (arrowheads) in digested PGC lobes of L1 larvae. Dashed lines, the outline of PGC cell bodies. (H) Quantification of Mito-DendraPGC over Mito-mChPGC ratio in L1 PGCs revealing acidification in lobe debris relative to the cell body. (I-I”) Mitochondrial transcription factor-A (TFAM)-green fluorescent protein (GFP) puncta within PGC mitochondria, present in both the cell body (dashed outlines) and in recently cannibalized lobes (arrowheads). Due to the movement of threefold embryos within the eggshell, TFAM-GFP appears diffuse. (J–L) TFAM-GFP in embryonic (J) and L1 larval (K) PGCs. (L) Quantification of TFAM-GFP foci in embryonic and L1 PGCs. Data in graphs are shown as a Superplot, with individual data points from three independent color-coded biological replicates shown as small dots, the mean from each experiment shown as a larger circle, the mean of means as a horizontal line, and the SEM as error bars. **p≤0.01, ***p≤0.001, ****p≤0.0001, unpaired two-tailed Student’s t-test (F,L) and paired-ratio Student’s t-test (H). Scale bars, 5 µm.
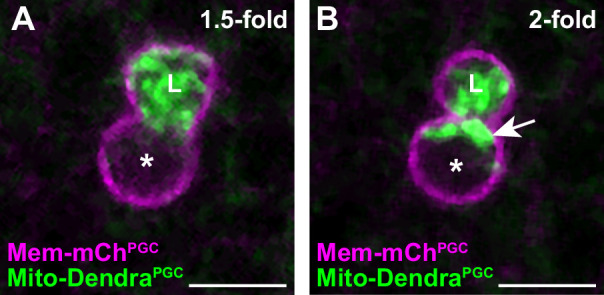
Figure 1—figure supplement 1. A subset of primordial germ cell (PGC) mitochondria is retained in the cell body prior to lobe digestion.


