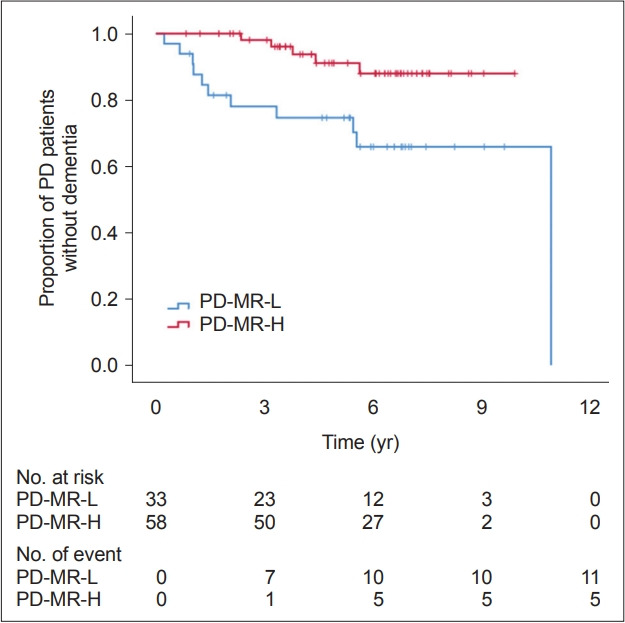
Figure 2.

Curves of Kaplan–Meier estimates of the occurrence of dementia after the onset of parkinsonian symptoms in PD-MR-H (n = 58) and PD-MR-L (n = 33). The PD-MR-L group had a higher risk of dementia conversion than did the PD-MR-H group (pLog-rank = 0.008). The crosses in the graphs indicate censored data. PD, Parkinson’s disease; PD-MR-H, PD patients with high motor reserve; PD-MR-L, PD patients with low motor reserve.
