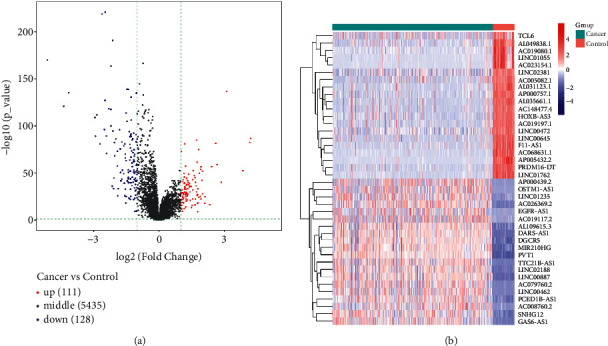
Figure 2.

Screening of differentially expressed lncRNAs. (a) Heat map of the first 20 differential lncRNAs in KIRC tumor tissues and normal tissues. The blue bar represents the cancer cases, and the red bar represents the control cases. (b) Volcano map of the differentially expressed lncRNAs. Red dots represent the upregulated lncRNAs and blue dots represent the downregulated lncRNAs.
