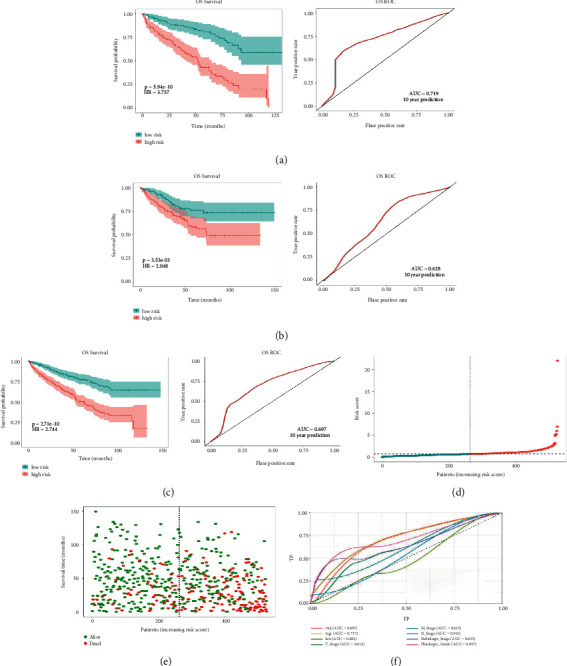
Figure 4.

Differences in prognosis between the high-risk and low-risk groups based on the prognostic signature. (a) Kaplan–Meier survival analysis in the training set and the 10-year ROC curves. (b) Kaplan–Meier survival analysis in the testing set and the 10-year ROC curves. (c) Kaplan–Meier survival analysis in the total cases and the 10-year ROC curves. (d) Risk score distribution of patients in the high-risk and low-risk groups. (e) Overall survival status distribution of KIRC patients with increased risk score. (f) The signature has a more favorable clinical value than the T stage, M stage, N stage, histological grade, and pathologic stage by ROC curve analysis.
