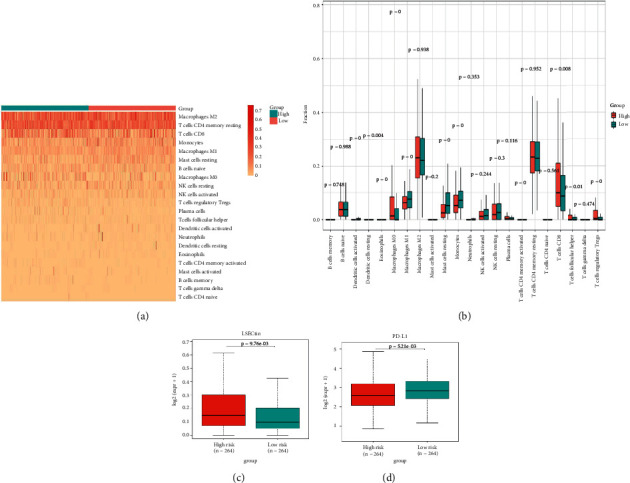
Figure 6.

Correlations between the risk scores and infiltration abundances of immune cells and immune checkpoints. (a) Heat map of immune infiltration cells between the high-risk and low-risk groups. (b) Box plot of immune infiltration between n the high-risk and low-risk groups. (c) Differential LSECtin expression in the high-risk and low-risk groups. (d) Differential PD-L1 expression in the high-risk and low-risk groups.
