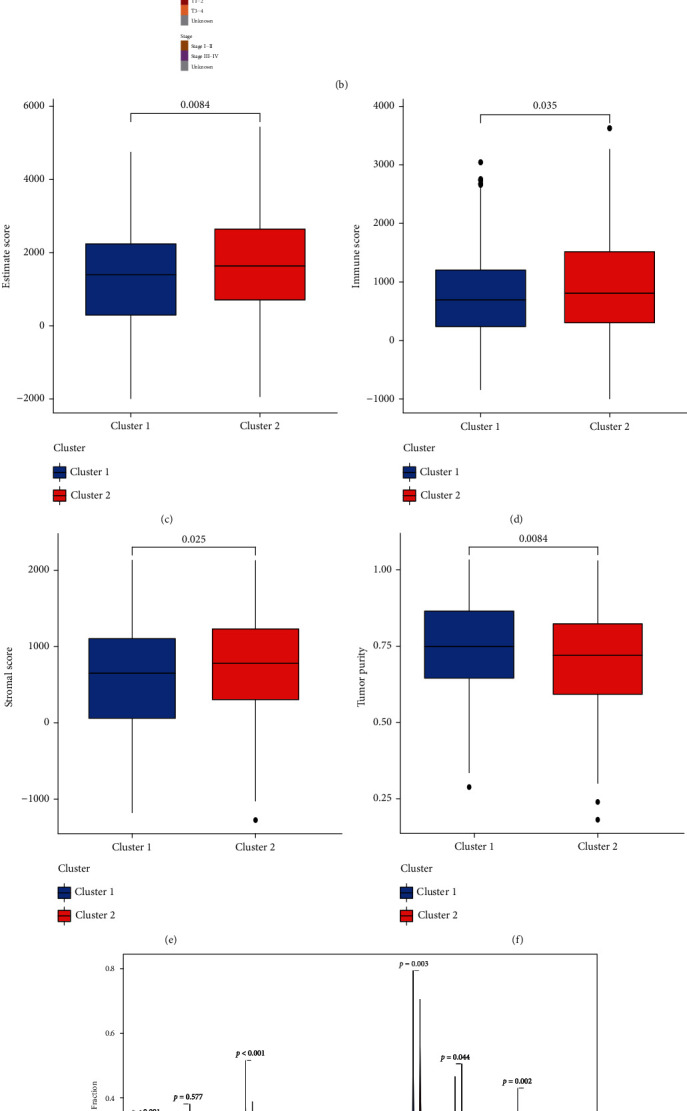
Figure 1.

(a) The samples were divided into 2 groups in keeping with the high and low expression of lncRNA. (b) The clinical connectedness of heat map and lncRNA expression between the 2 groups. (c) ESTIMATE score. (d) Immune score. (e) Stromal score. (f) Neoplasm purity. (g) Percentage of infiltrating immune cells. (h) Immunocell correlation diagram in cluster.
