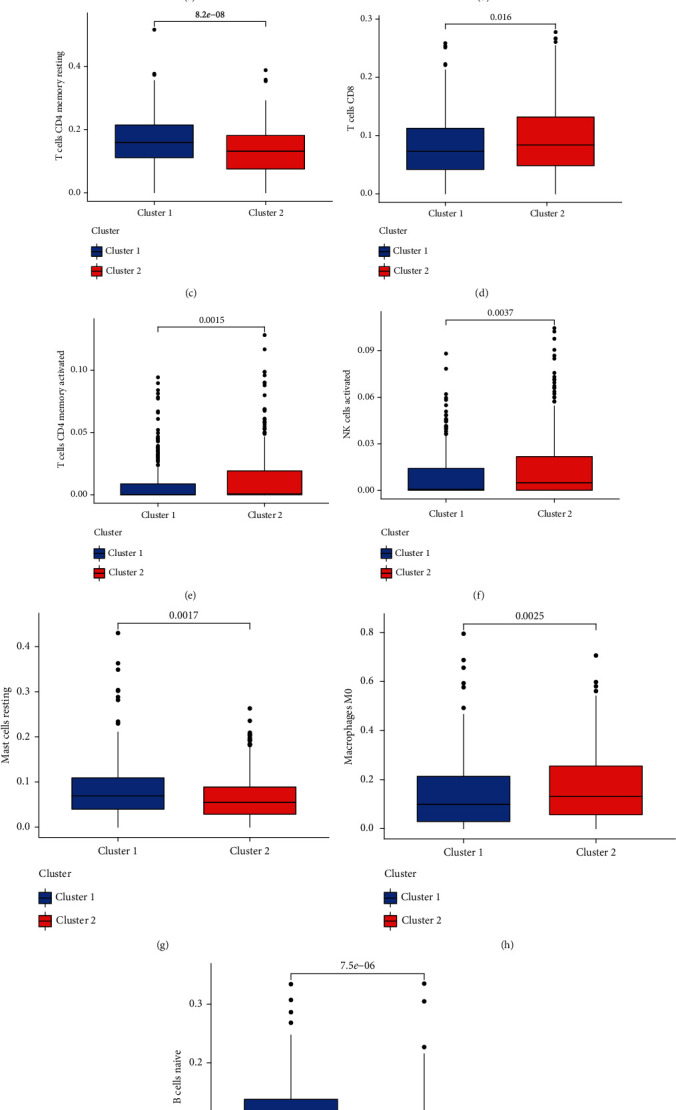
Figure 2.

Analysis of immune-related differences between the two groups. (a) T-cell regulatory (Treg) comparison between the two subgroups. (b) T-cell comparison between the two subgroups. (c) T-cell CD4 memory resting between the two subgroups. (d) T-cell CD8 between the two subgroups. (e) T-cell CD4 memory activated between the two subgroups. (f) TNK-cell activated comparison between the two subgroups. (g) Mast cell resting comparison between the two subgroups. (h) Macrophage M0 comparison between the two subgroups. (i) B-cell naive comparison between the two subgroups.
