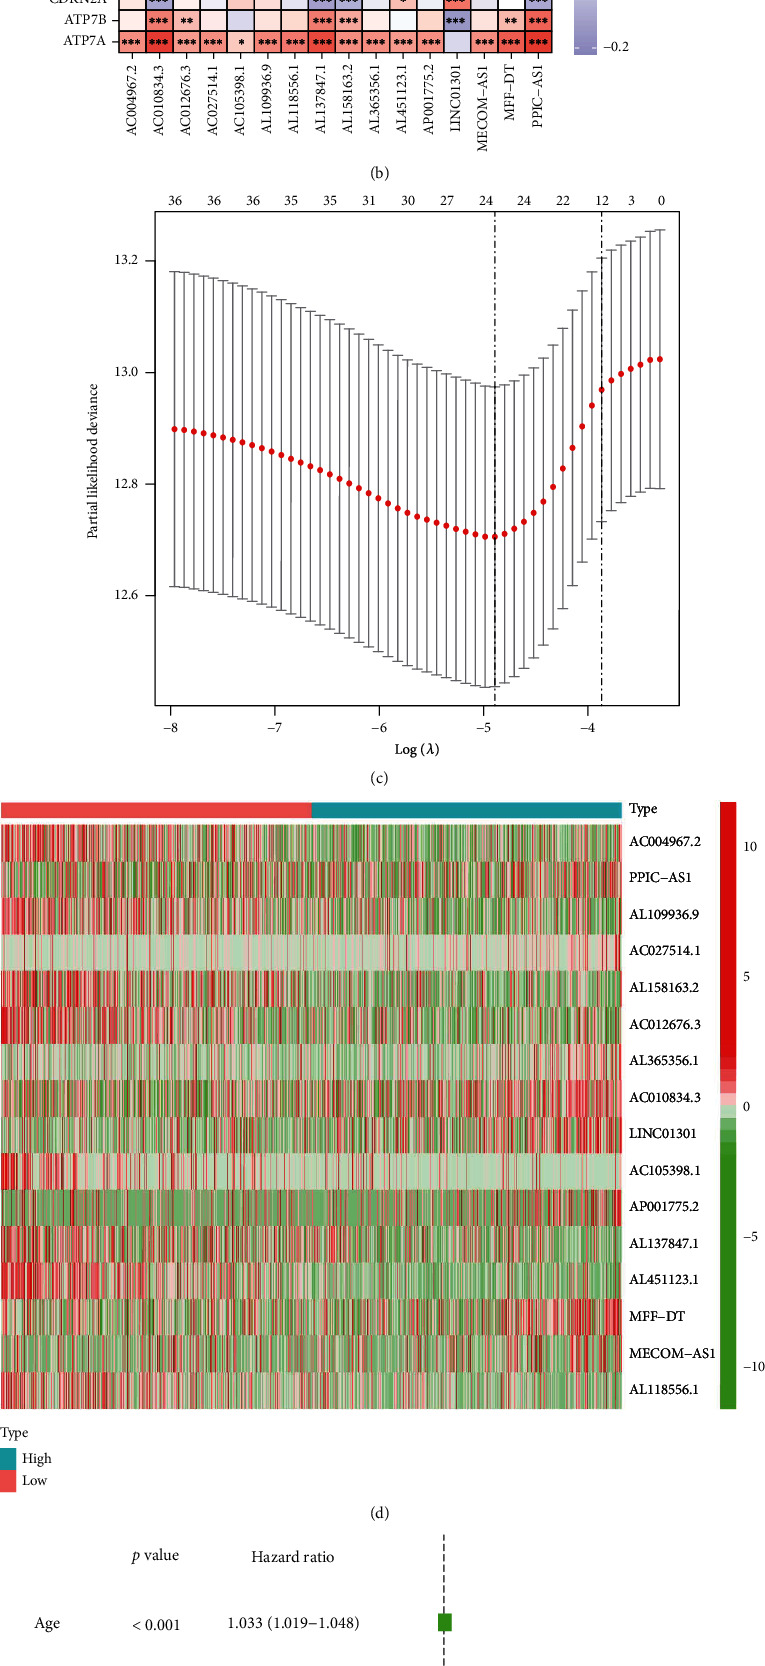
Figure 3.

(a) Forest map of 37 CuPro-related lncRNAs. (b) Heat map of the correlation between lncRNA and cuproptosis-related targets. (c) A prognostic risk prediction model was constructed. (d) lncRNA heat map of the different levels of risk groups. (e–f) Seven clinically relevant forest maps were analyzed by univariate Cox regression.
