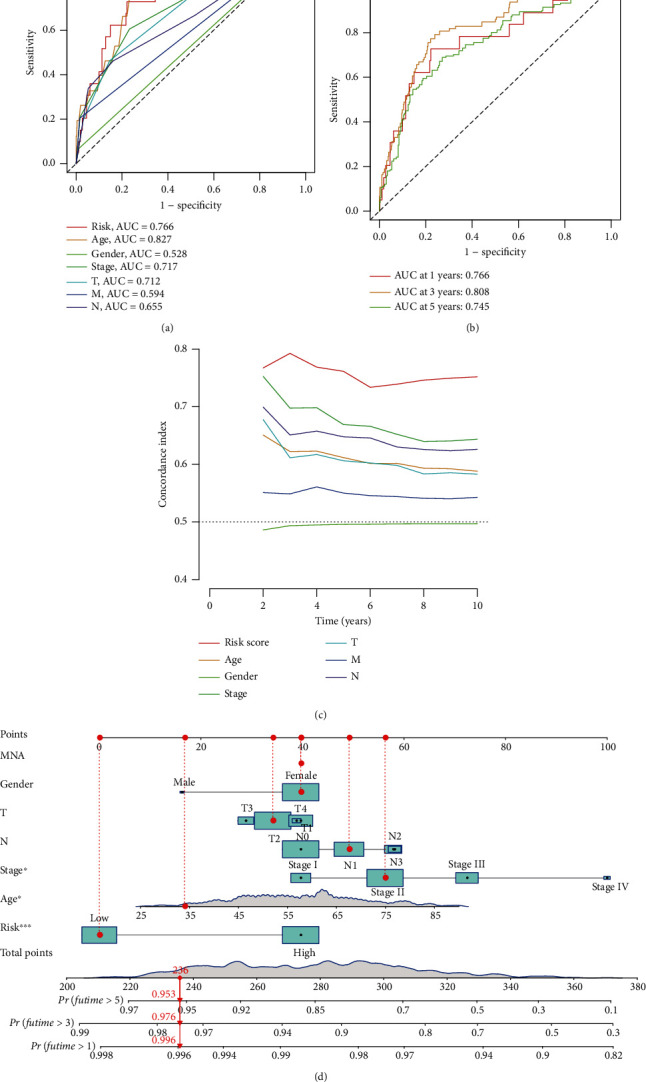
Figure 4.

(a) Clinically relevant ROC curve of the model. (b) 1-3 year ROC curve of the model. (c) C-index curve of 7 clinical factories. (d) Nomogram score and clinical characteristics.

(a) Clinically relevant ROC curve of the model. (b) 1-3 year ROC curve of the model. (c) C-index curve of 7 clinical factories. (d) Nomogram score and clinical characteristics.