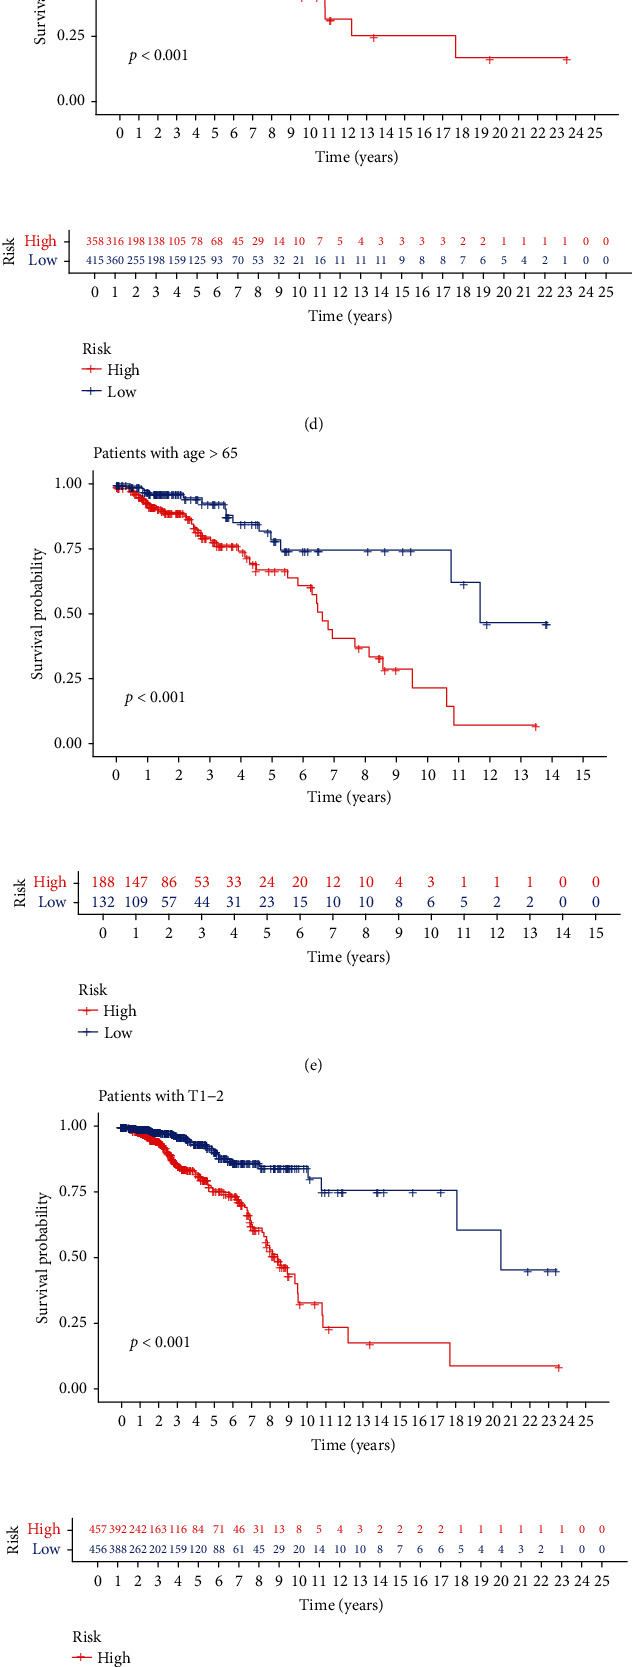
Figure 5.

Survival risk scoring model. (a, b) Survival rate of patients in the medium-high risk group with different tumor stages. (c) Survival rate of women in the medium-high risk group. (d, e) Survival rate of patients in different age groups with high and low risk. (f, g) Survival rate of patients in the low-medium risk groups with different T stages of tumor tissue. (h, i) Survival rate of patients in the medium-high risk groups with different N stages of tumor tissue.
