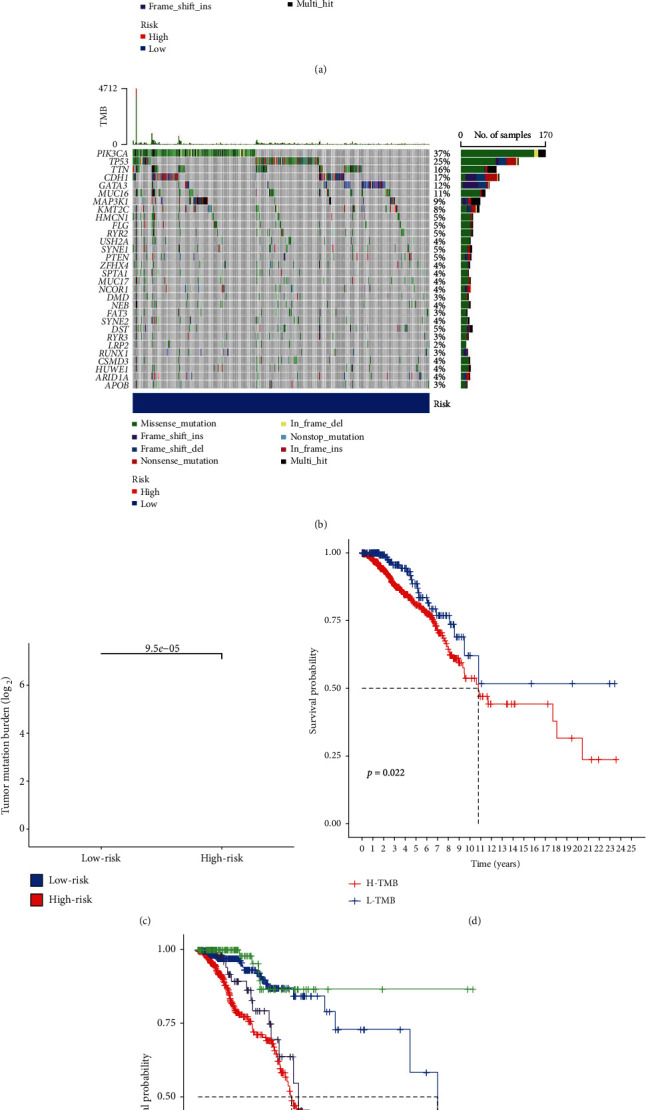
Figure 7.

Analysis of mutation burden in breast cancer samples. (a, b) Waterfall diagram of gene mutations in samples from the groups of different risks. (c) Relationship between tumor mutation burden in samples from the groups of high-low risk. (d) Relationship between survival rate in the high-low mutation burden group. (e) Relationship between survival rate in the high-low mutation burden group and the high-high risk group.
