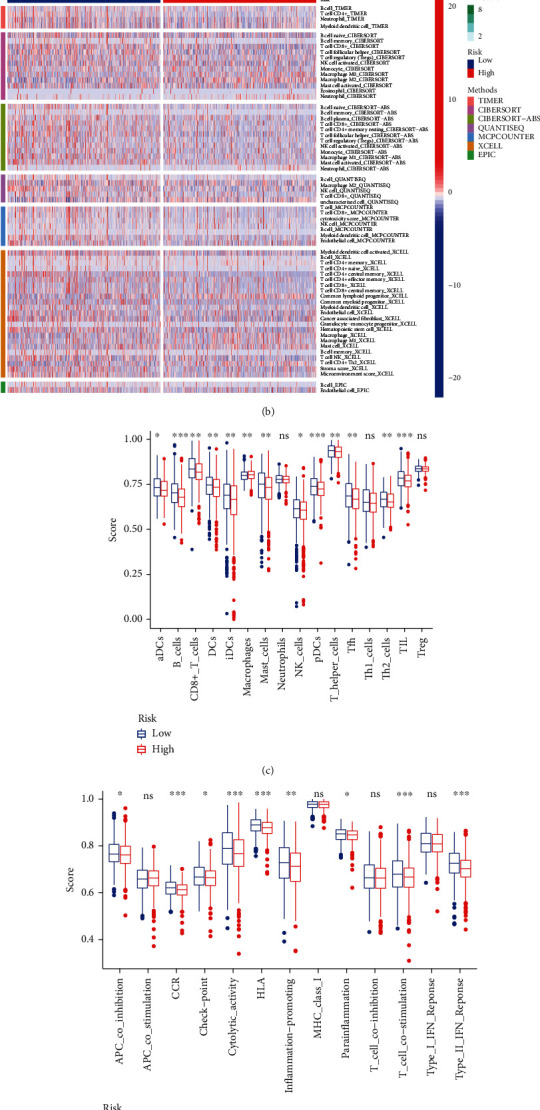
Figure 9.

Analysis of immune-related functional differences based on GO analysis results. (a) Immune cell map of the sample. (b) Immune-related heat map. (c) Map of immune cells in the groups of different risks. (d) Map of immune function in the groups of different risks. (e) Map of immune checkpoints.
