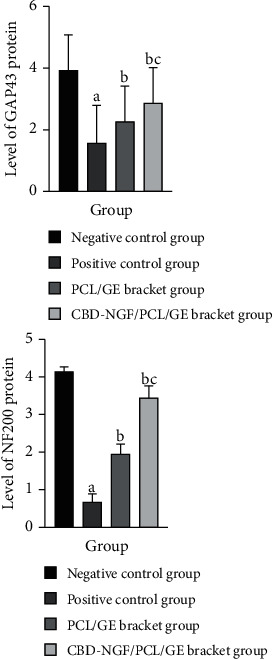
Figure 3.

GAP43 and NF200 protein levels in spinal cord tissue. Note: (a) indicates a significant difference (P < 0.05) when compared with negative controls; (b) indicates a significant difference (P < 0.05) when compared with positive controls; (c) indicates a significant difference (P < 0.05) when compared with the PCL/GE group.
