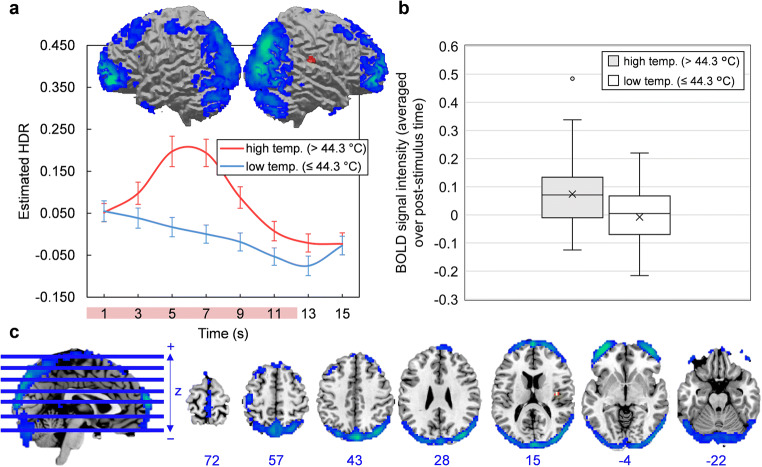
Fig. 4.
a-c Component 3. a Three-dimensional rendering of Component 3 (based on the top 10% of component loadings) and estimated HDRs associated with this network over the course of one thermal stimulation trial. The red bar placed over x-axis tick labels indicates the duration of a thermal stimulus (12.5 s). Estimated HDRs were obtained by averaging the FIR-based predictor weights for each condition level and plotting them as a function of post-stimulus time. Blue coloring indicates negative loadings; graphs should be interpreted as displaying the intensity of deactivation instead of activation. Error bars given by standard error. HDR = hemodynamic response. b Boxplots illustrating the distributions of Component 3 BOLD signal across participants, for both high and low temperature stimuli. In both cases, BOLD signal was first averaged over the entire post-stimulus time interval for each participant and each condition. The mean is given by ×. c Horizontal cross-sections of Component 3 (only the top 10% of component loadings are shown). Negative loadings in blue, threshold = −0.08, max = −0.16. Positive loadings in red, threshold 0.08, max = 0.09. Blue values indicate the MNI coordinate of each slice in the z direction

